 10
10peptides
spectra
0.000 | 0.000
1.000 | 1.000
0.000 | 0.000
0.000 | 0.000
0.000 | 0.000
0.000 | 0.000
0.000 | 0.000
0.000 | 0.000
| Plot | Mito | Lyso | Perox | ER | Golgi | PM | Cytosol | Nucleus | |||||
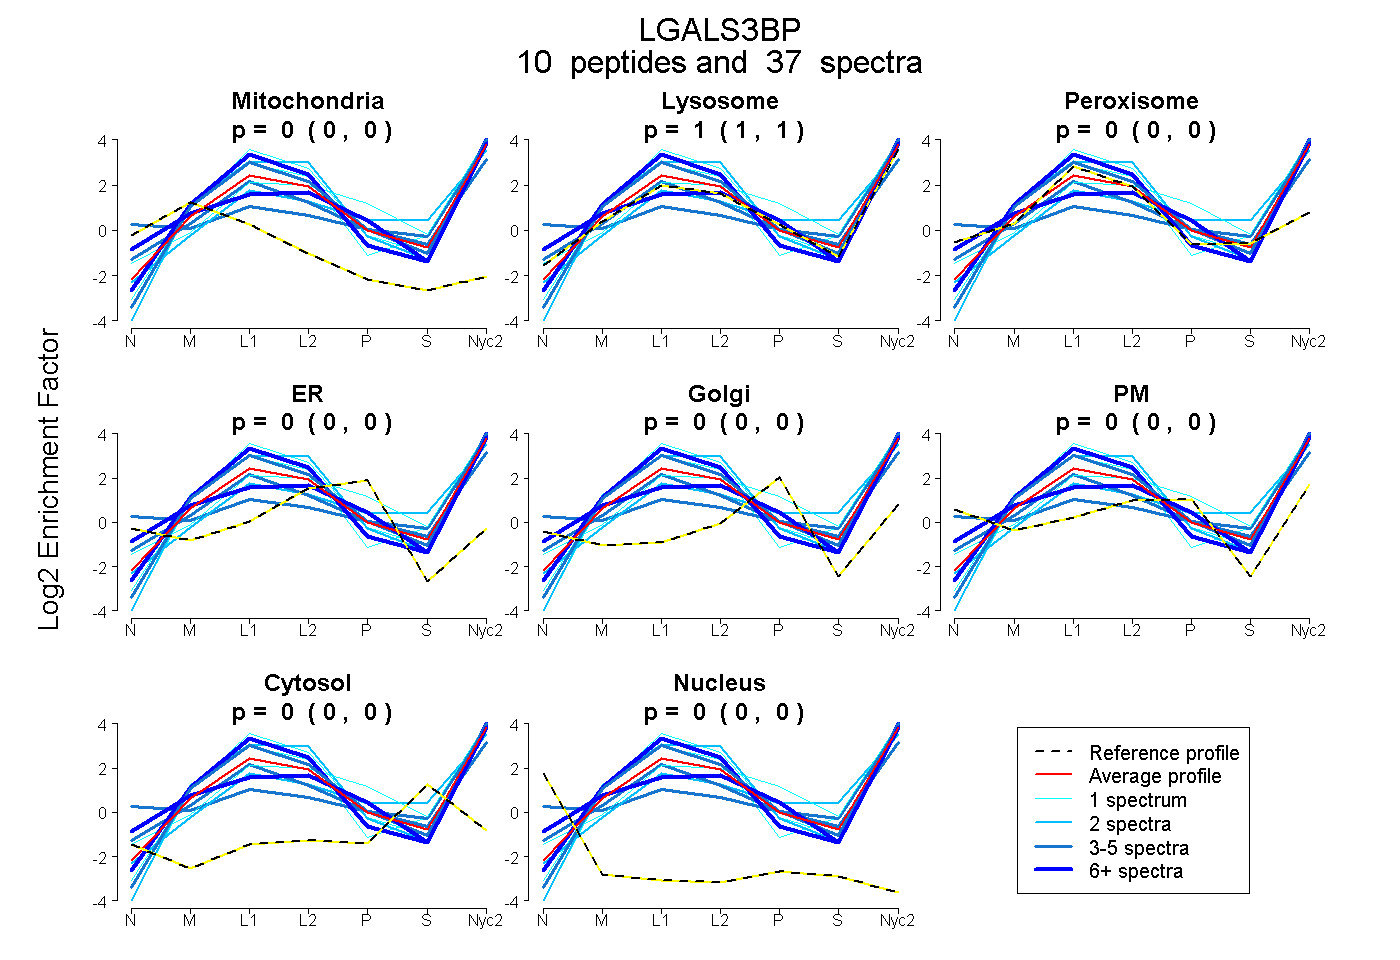
| Expt A |
10 peptides |
37 spectra |
|
0.000 0.000 | 0.000 |
1.000 1.000 | 1.000 |
0.000 0.000 | 0.000 |
0.000 0.000 | 0.000 |
0.000 0.000 | 0.000 |
0.000 0.000 | 0.000 |
0.000 0.000 | 0.000 |
0.000 0.000 | 0.000 |
| 2 spectra, LVNGASASEGR | 0.000 | 1.000 | 0.000 | 0.000 | 0.000 | 0.000 | 0.000 | 0.000 | ||
| 2 spectra, LVEQLR | 0.000 | 0.870 | 0.000 | 0.000 | 0.000 | 0.000 | 0.130 | 0.000 | ||
| 1 spectrum, DAGVVCSNDSR | 0.000 | 1.000 | 0.000 | 0.000 | 0.000 | 0.000 | 0.000 | 0.000 | ||
| 1 spectrum, AAFGPGK | 0.000 | 1.000 | 0.000 | 0.000 | 0.000 | 0.000 | 0.000 | 0.000 | ||
| 3 spectra, VEIFYR | 0.000 | 1.000 | 0.000 | 0.000 | 0.000 | 0.000 | 0.000 | 0.000 | ||
| 4 spectra, AVDQWSTATGASHGDVER | 0.000 | 0.563 | 0.000 | 0.000 | 0.000 | 0.334 | 0.103 | 0.000 | ||
| 6 spectra, YFYSR | 0.000 | 0.879 | 0.000 | 0.000 | 0.000 | 0.121 | 0.000 | 0.000 | ||
| 13 spectra, VDAECMPVVR | 0.000 | 1.000 | 0.000 | 0.000 | 0.000 | 0.000 | 0.000 | 0.000 | ||
| 4 spectra, SELAVSSELDLLK | 0.000 | 0.963 | 0.000 | 0.000 | 0.000 | 0.000 | 0.037 | 0.000 | ||
| 1 spectrum, TMEALEFHTVPLK | 0.000 | 1.000 | 0.000 | 0.000 | 0.000 | 0.000 | 0.000 | 0.000 |
| Plot | Mito | Lyso or Perox | ER | Golgi | PM | Cytosol | Nucleus | ||||||
| Expt B |
5 peptides |
7 spectra |
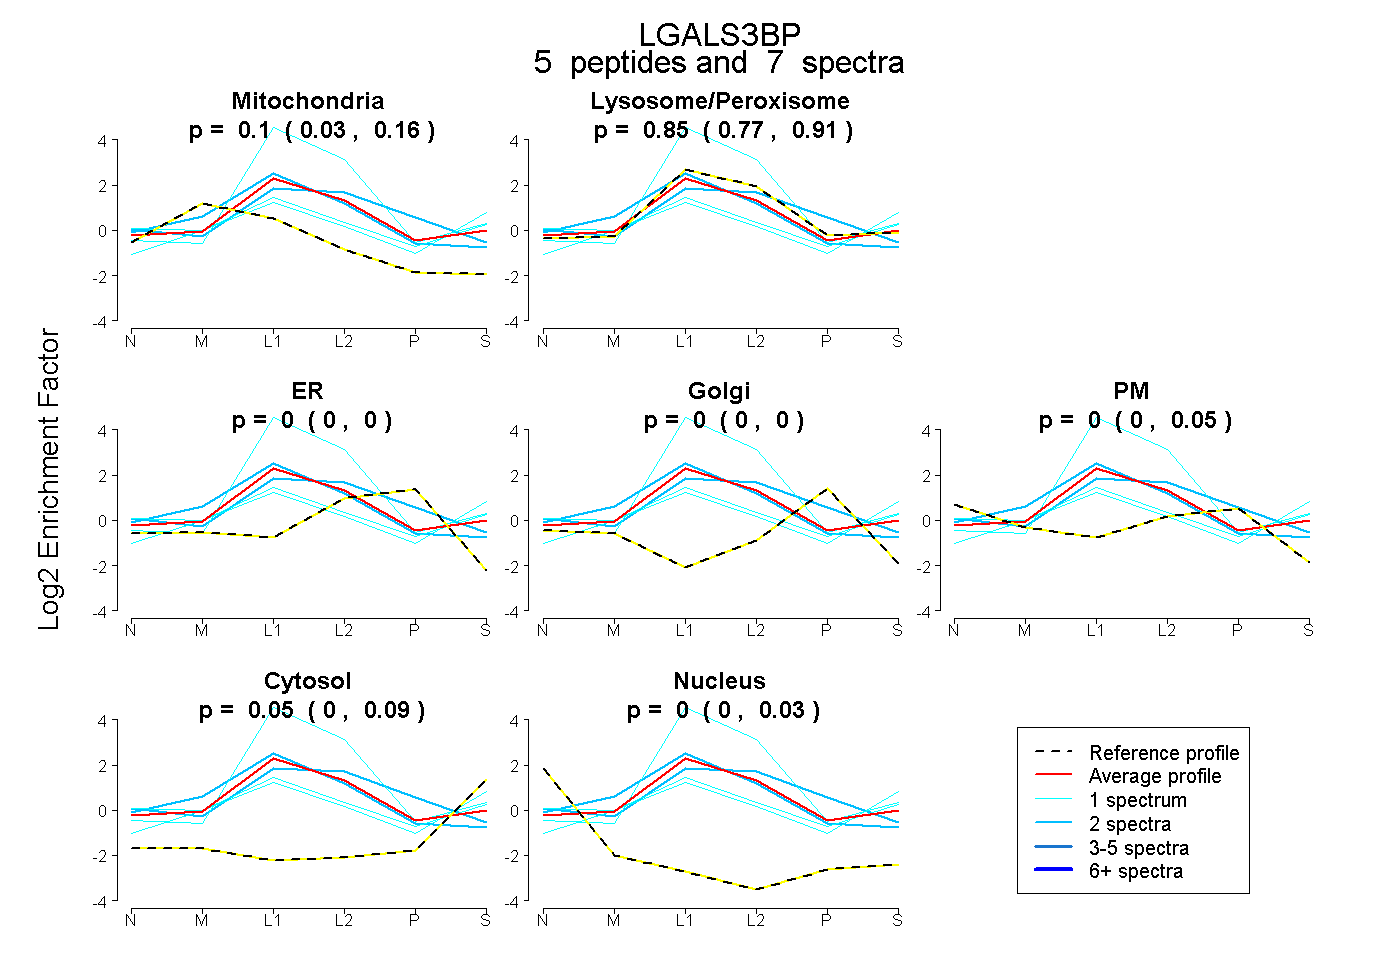 |
0.105 0.033 | 0.155 |
0.845 0.767 | 0.908 |
0.000 0.000 | 0.000 |
0.000 0.000 | 0.000 |
0.000 0.000 | 0.049 |
0.049 0.000 | 0.087 |
0.001 0.000 | 0.027 |
|||
| Plot | Lyso | Other | |||||||||||
| Expt C |
15 peptides |
272 spectra |
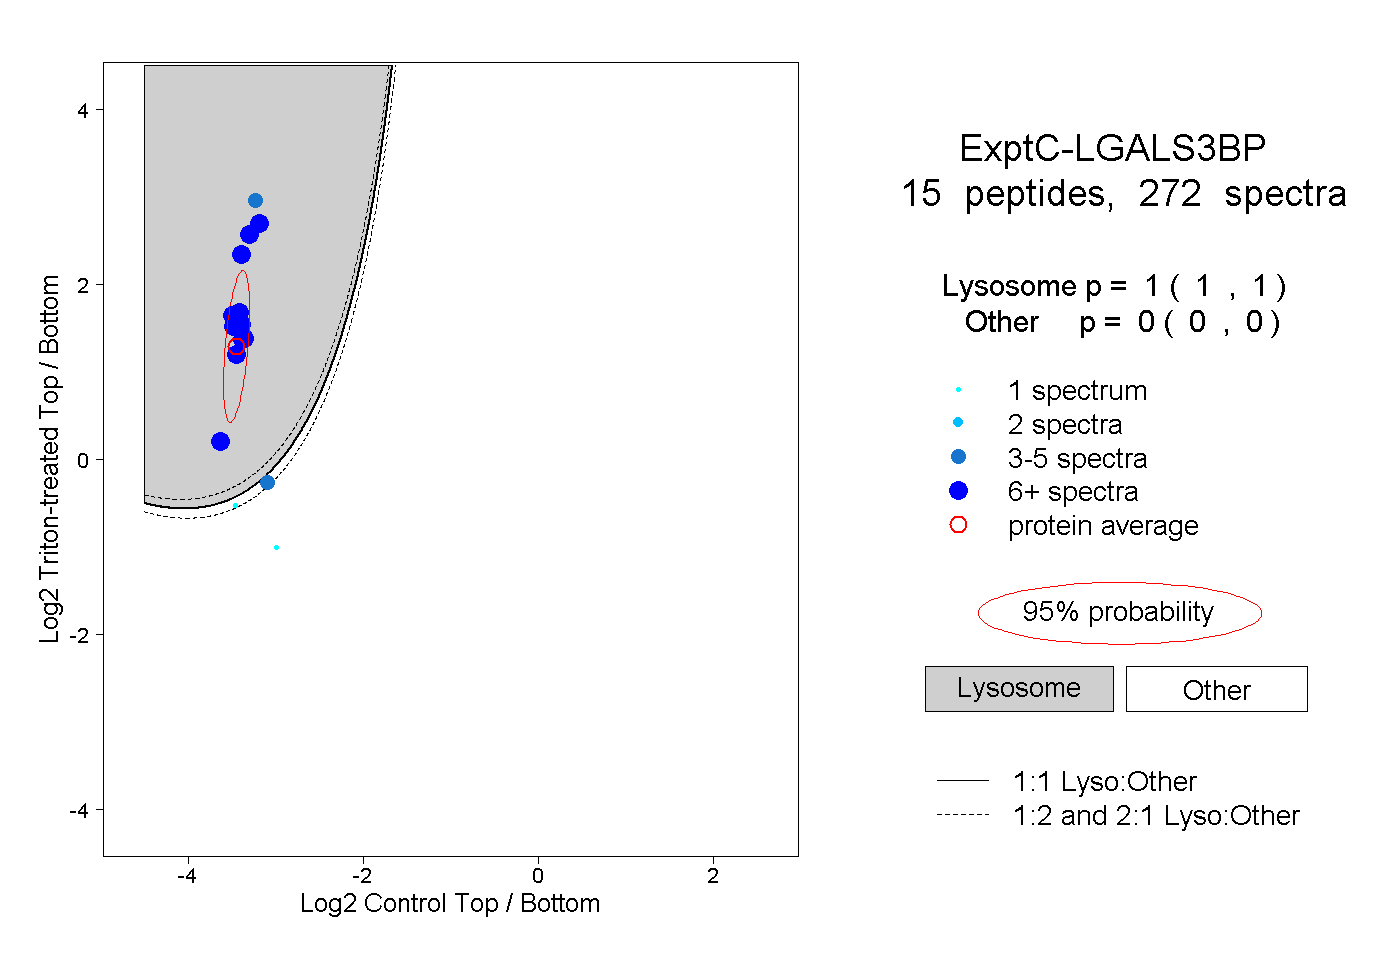 |
1.000 1.000 | 1.000 |
0.000 0.000 | 0.000 |
||||||||
| Plot | Lyso | Other | |||||||||||
| Expt D |
6 peptides |
13 spectra |
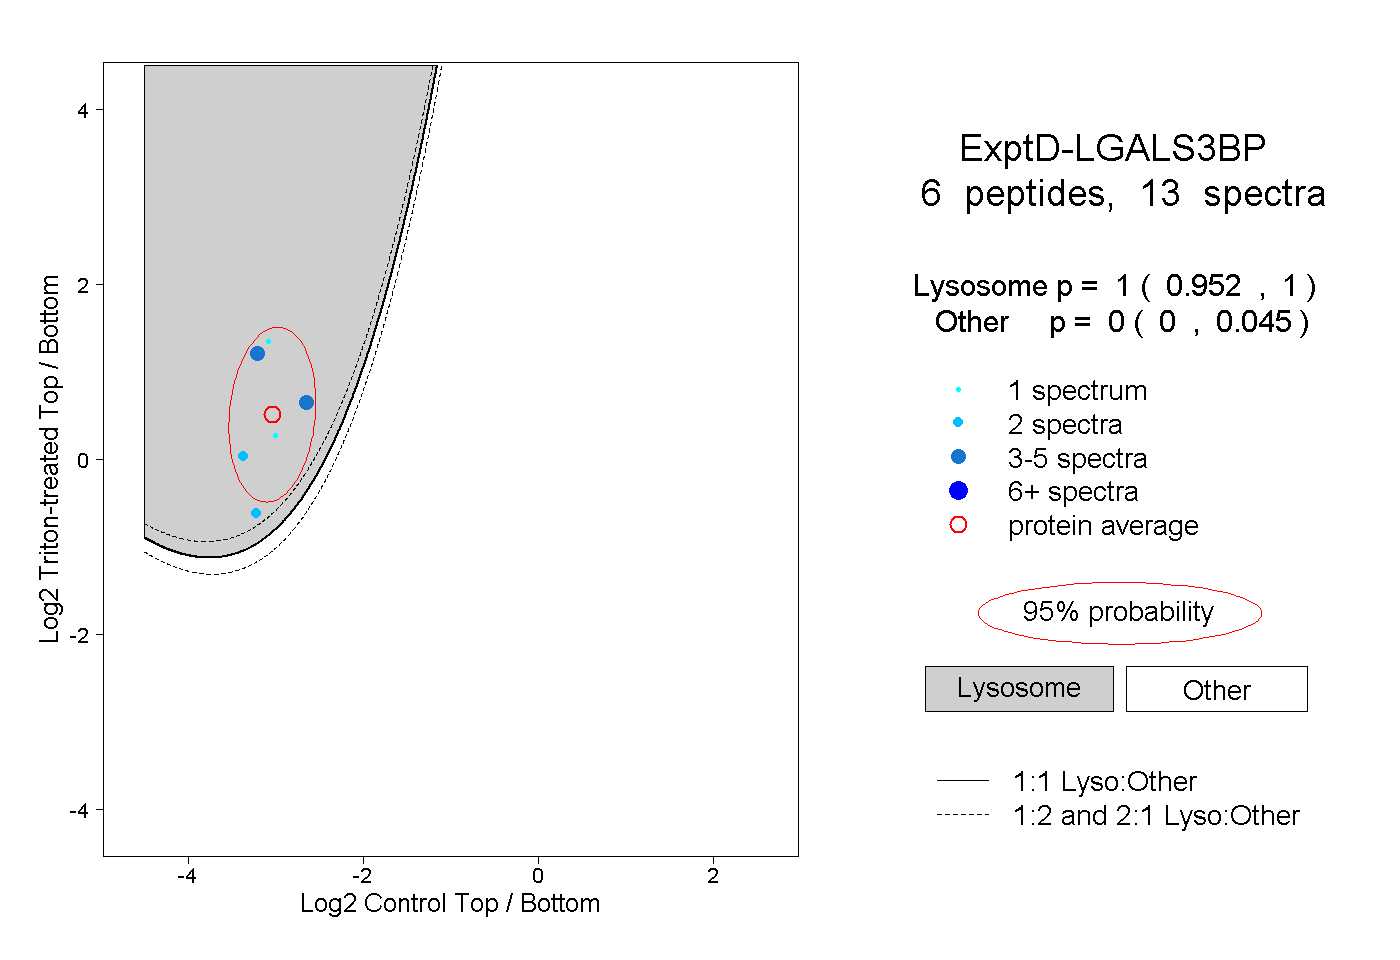 |
1.000 0.952 | 1.000 |
0.000 0.000 | 0.045 |