 5
5peptides
spectra
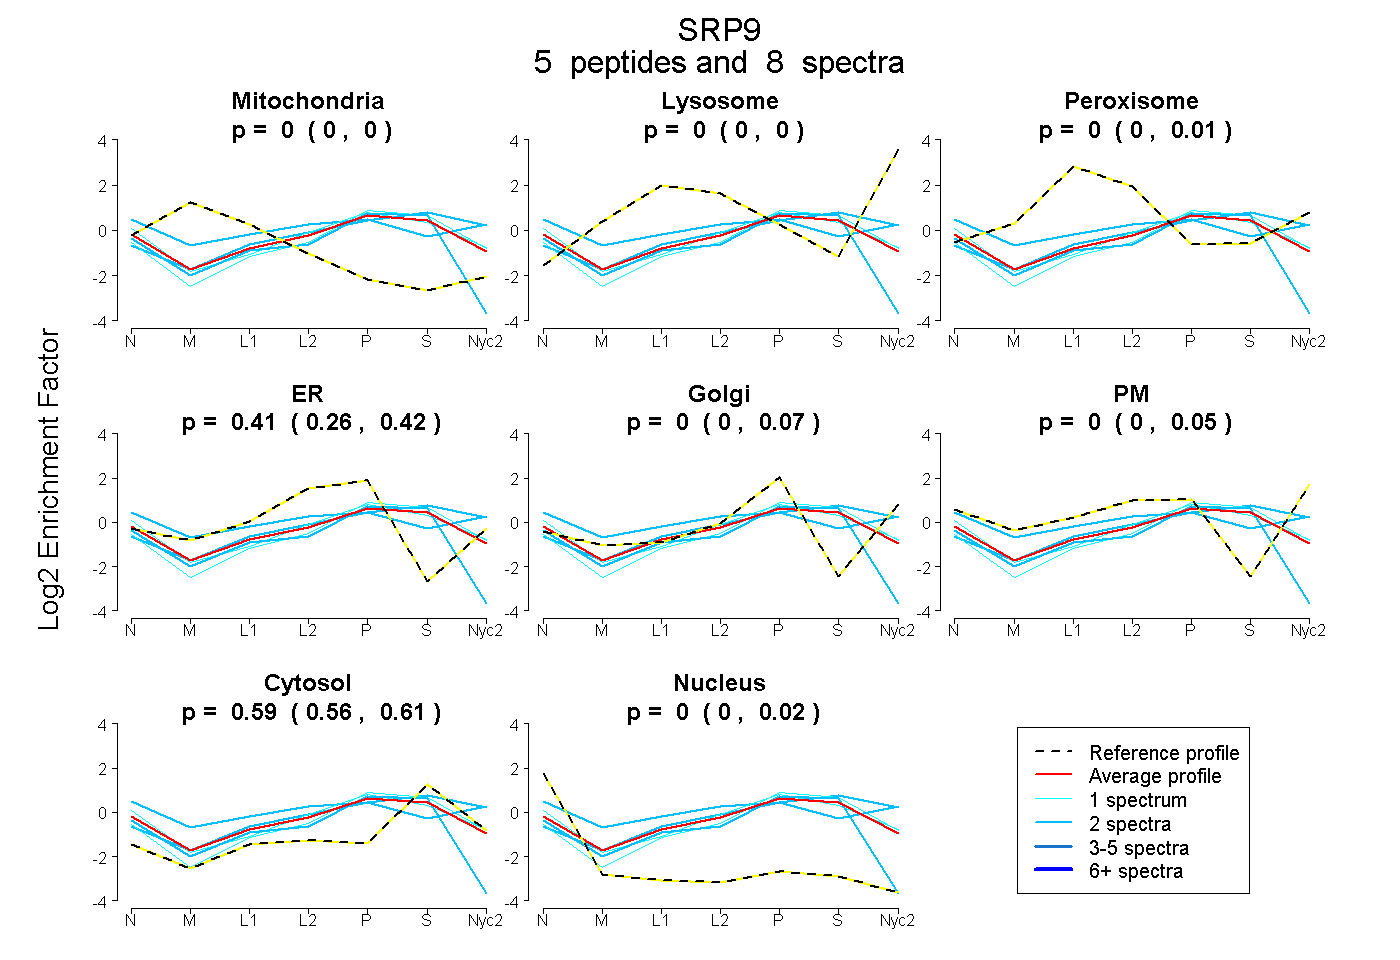
0.000 | 0.000
0.000 | 0.000
0.000 | 0.010
0.259 | 0.417
0.000 | 0.072
0.000 | 0.050
0.559 | 0.609
0.000 | 0.020
1peptide
spectra
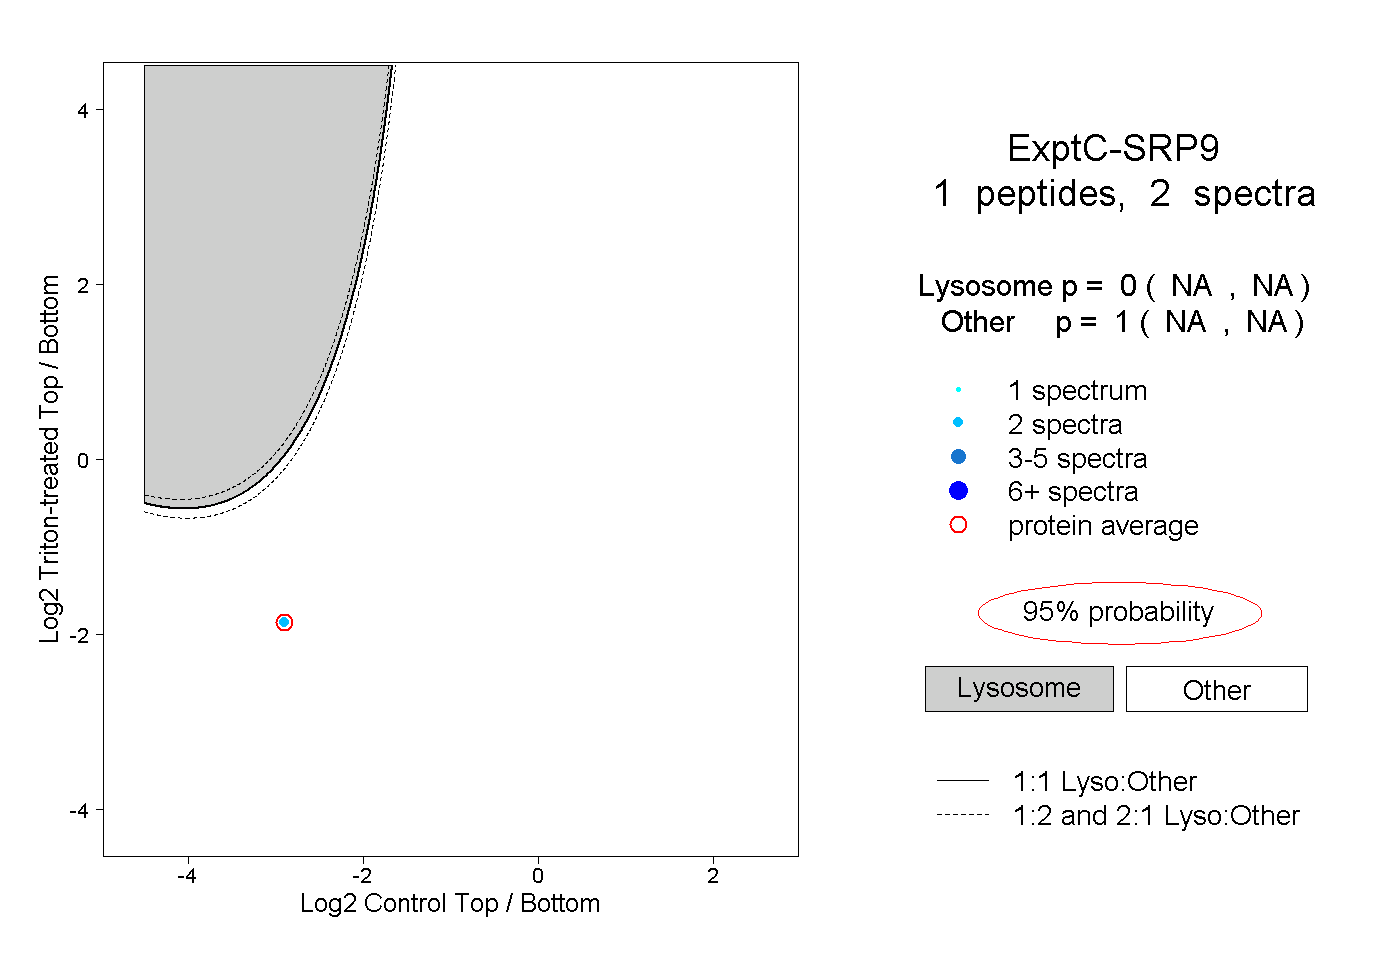
NA | NA
NA | NA
| Plot | Mito | Lyso | Perox | ER | Golgi | PM | Cytosol | Nucleus | |||||
| Expt A |
5 peptides |
8 spectra |
|
0.000 0.000 | 0.000 |
0.000 0.000 | 0.000 |
0.000 0.000 | 0.010 |
0.405 0.259 | 0.417 |
0.000 0.000 | 0.072 |
0.000 0.000 | 0.050 |
0.595 0.559 | 0.609 |
0.000 0.000 | 0.020 |
||
| Plot | Lyso | Other | |||||||||||
| Expt C |
1 peptide |
2 spectra |
|
0.000 NA | NA |
1.000 NA | NA |