 5
5peptides
spectra
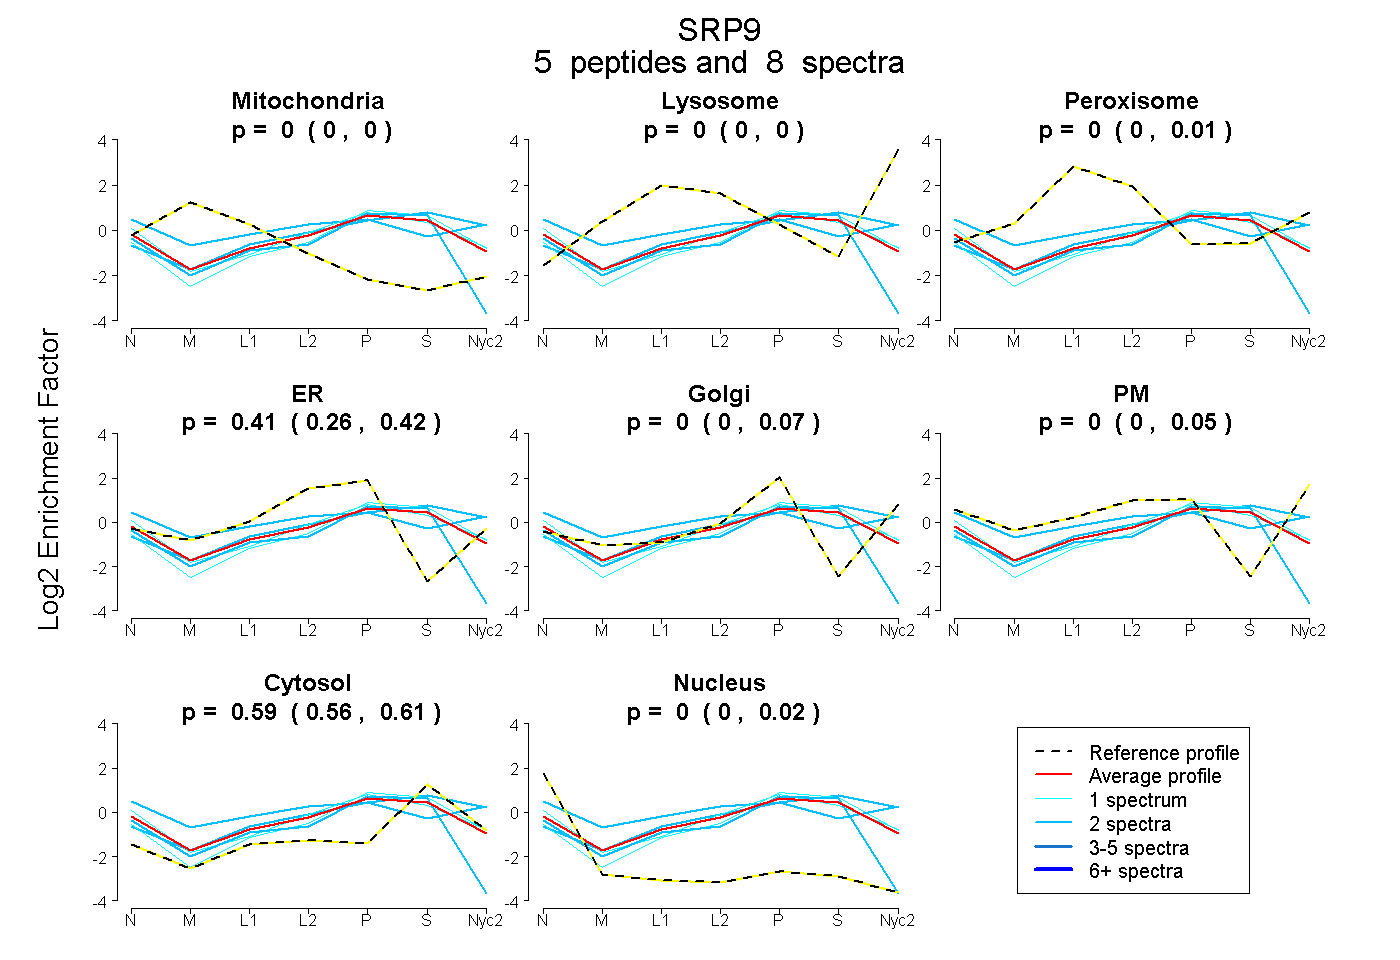
0.000 | 0.000
0.000 | 0.000
0.000 | 0.010
0.259 | 0.417
0.000 | 0.072
0.000 | 0.050
0.559 | 0.609
0.000 | 0.020
| Plot | Mito | Lyso | Perox | ER | Golgi | PM | Cytosol | Nucleus | |||||
| Expt A |
5 peptides |
8 spectra |
|
0.000 0.000 | 0.000 |
0.000 0.000 | 0.000 |
0.000 0.000 | 0.010 |
0.405 0.259 | 0.417 |
0.000 0.000 | 0.072 |
0.000 0.000 | 0.050 |
0.595 0.559 | 0.609 |
0.000 0.000 | 0.020 |
| 2 spectra, VTDDLVCLVYR | 0.000 | 0.000 | 0.000 | 0.281 | 0.000 | 0.000 | 0.551 | 0.168 | ||
| 1 spectrum, TDQAQDVK | 0.000 | 0.000 | 0.000 | 0.366 | 0.077 | 0.000 | 0.554 | 0.003 | ||
| 2 spectra, HVDGNLCIK | 0.000 | 0.084 | 0.088 | 0.028 | 0.237 | 0.005 | 0.558 | 0.000 | ||
| 2 spectra, SVAMETE | 0.000 | 0.000 | 0.120 | 0.051 | 0.000 | 0.469 | 0.351 | 0.009 | ||
| 1 spectrum, LYLADPMK | 0.000 | 0.000 | 0.000 | 0.179 | 0.177 | 0.000 | 0.643 | 0.000 |
| Plot | Lyso | Other | |||||||||||
| Expt C |
1 peptide |
2 spectra |
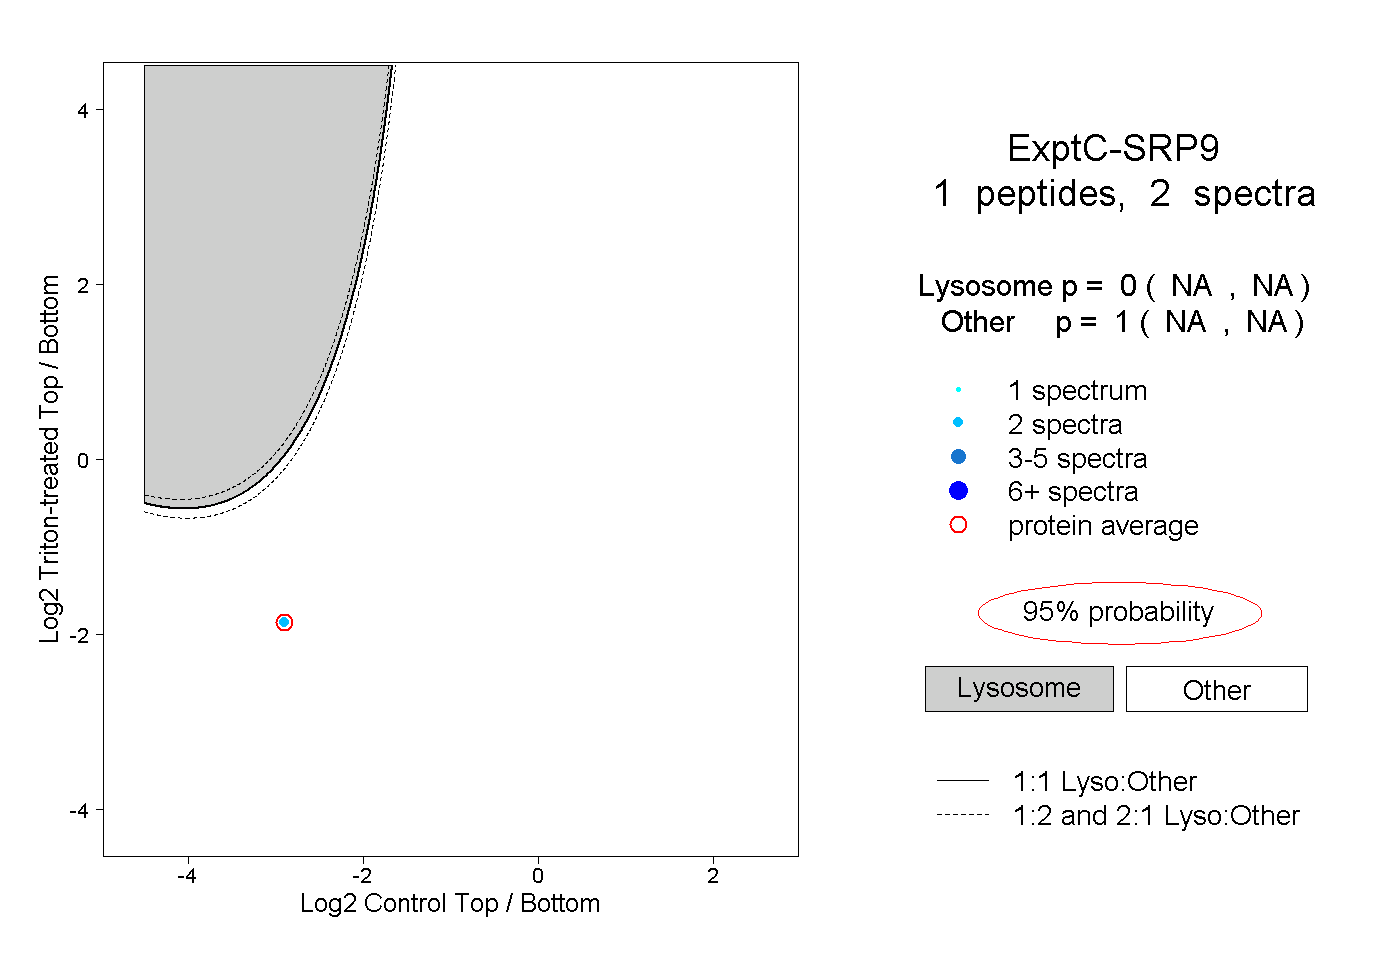 |
0.000 NA | NA |
1.000 NA | NA |