 9
9peptides
spectra
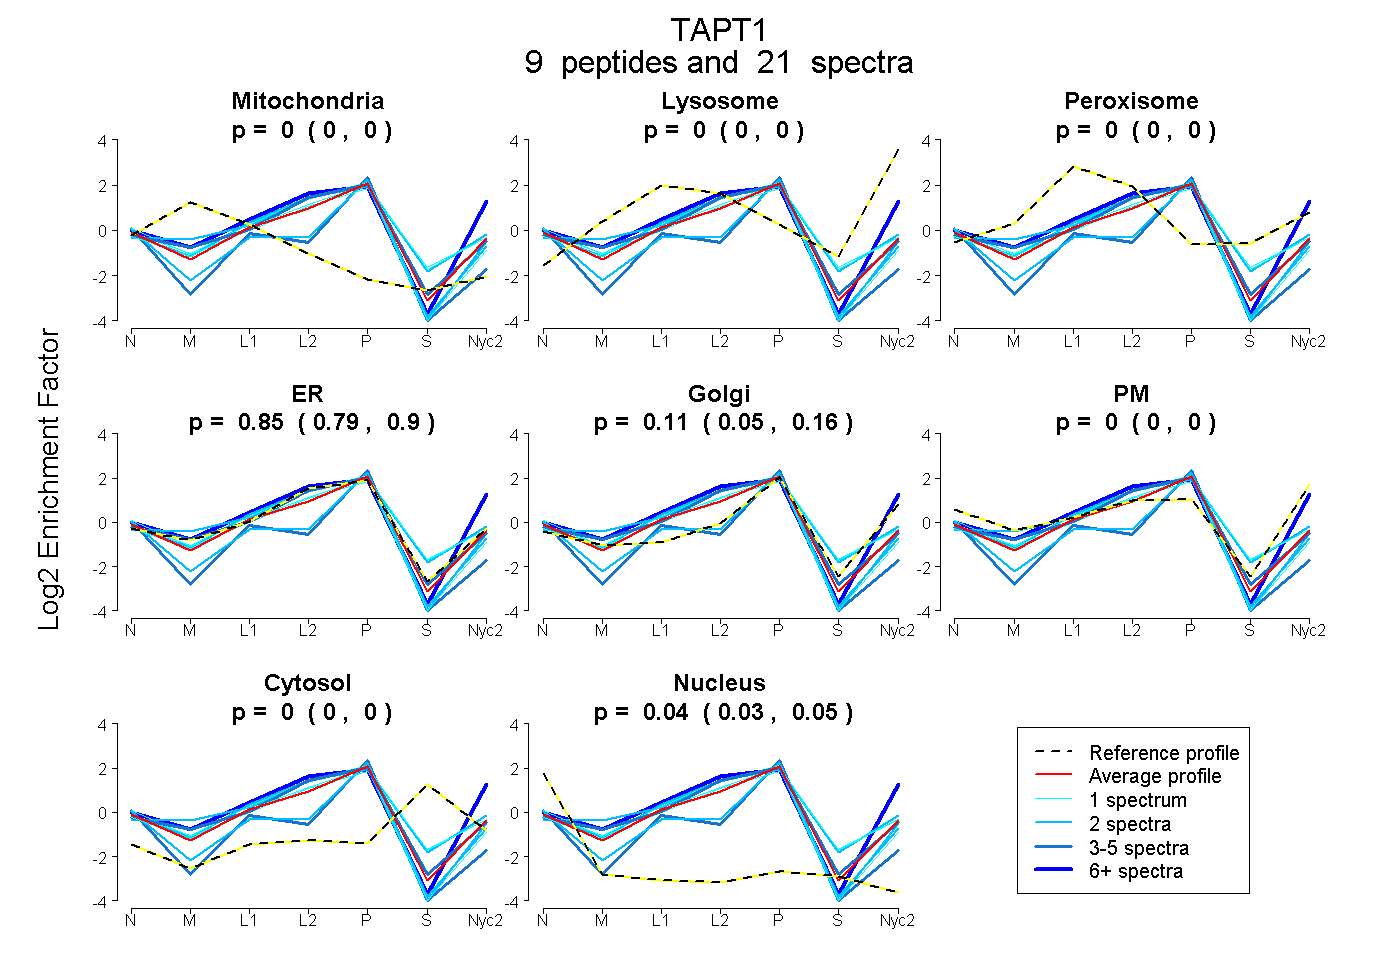
0.000 | 0.000
0.000 | 0.000
0.000 | 0.000
0.793 | 0.895
0.050 | 0.162
0.000 | 0.000
0.000 | 0.000
0.026 | 0.050
3peptides
spectra
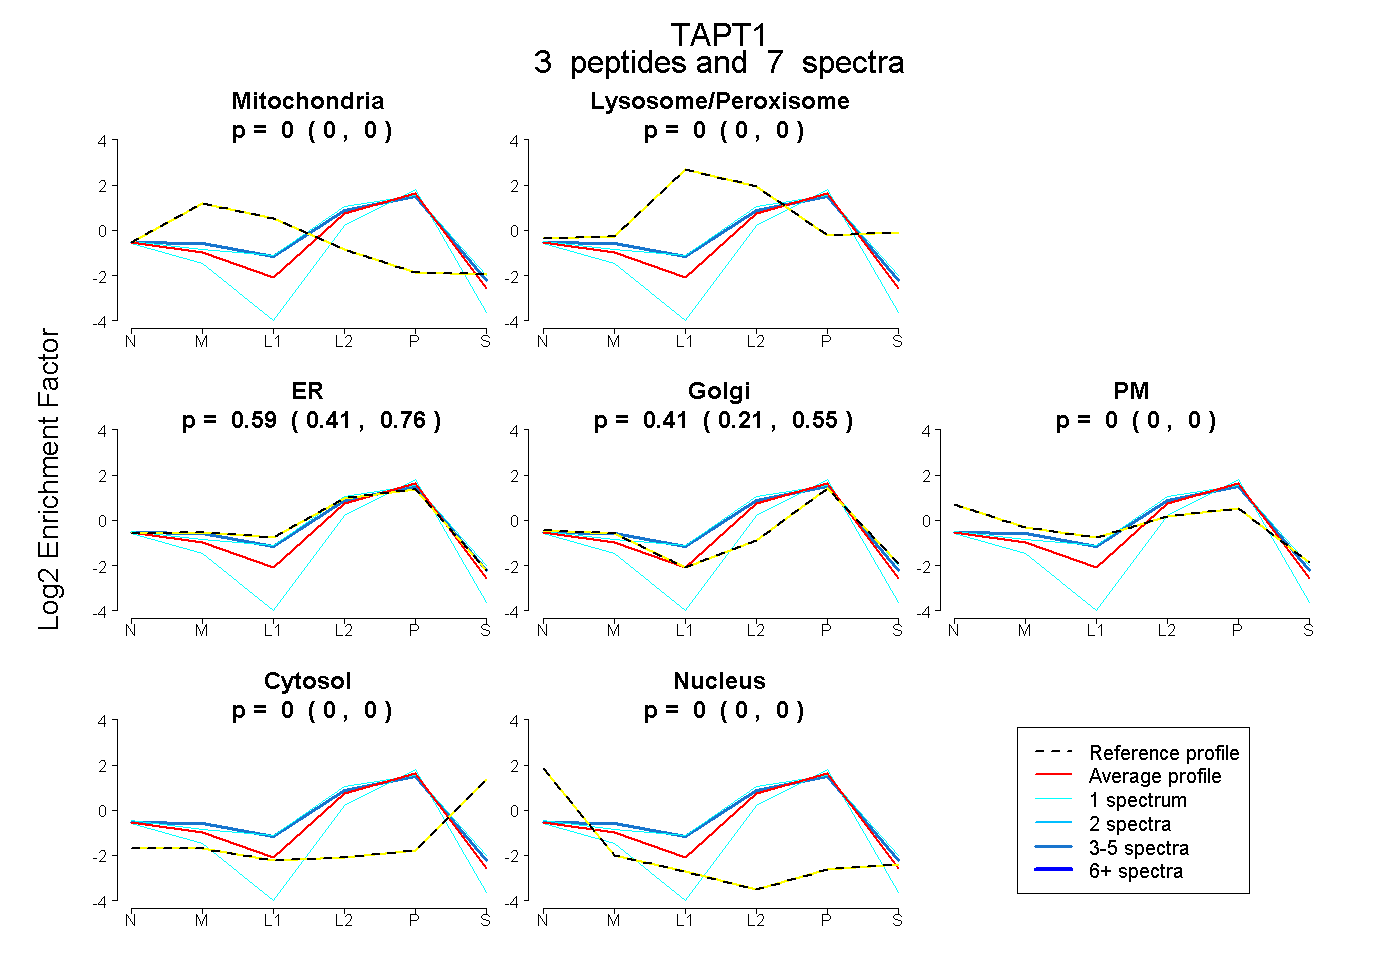
0.000 | 0.000
0.000 | 0.000
0.413 | 0.759
0.209 | 0.554
0.000 | 0.000
0.000 | 0.000
0.000 | 0.000
9peptides
spectra
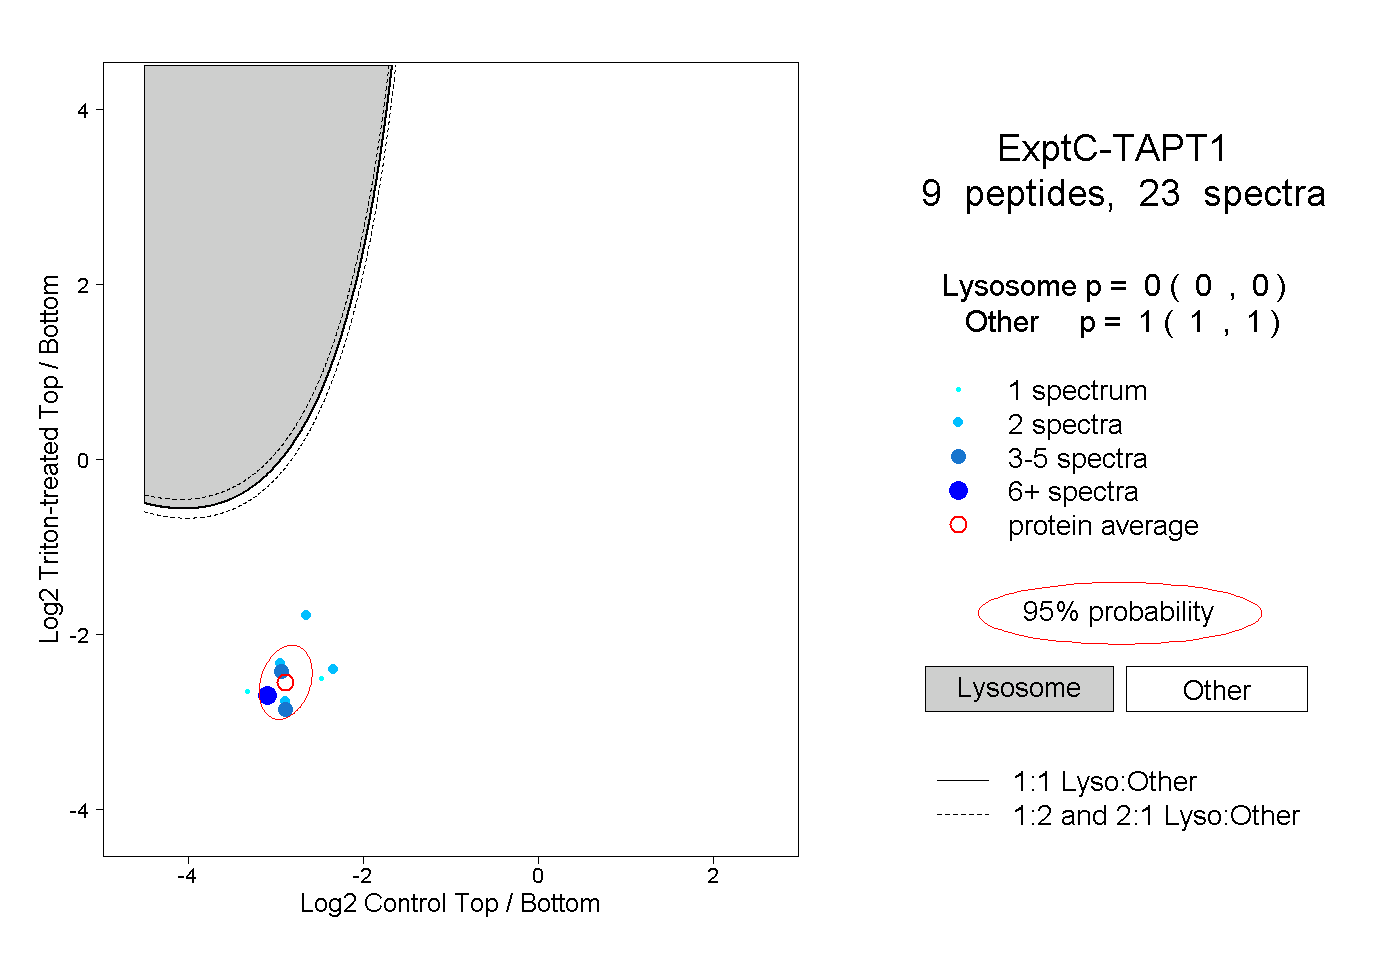
0.000 | 0.000
1.000 | 1.000
2peptides
spectra
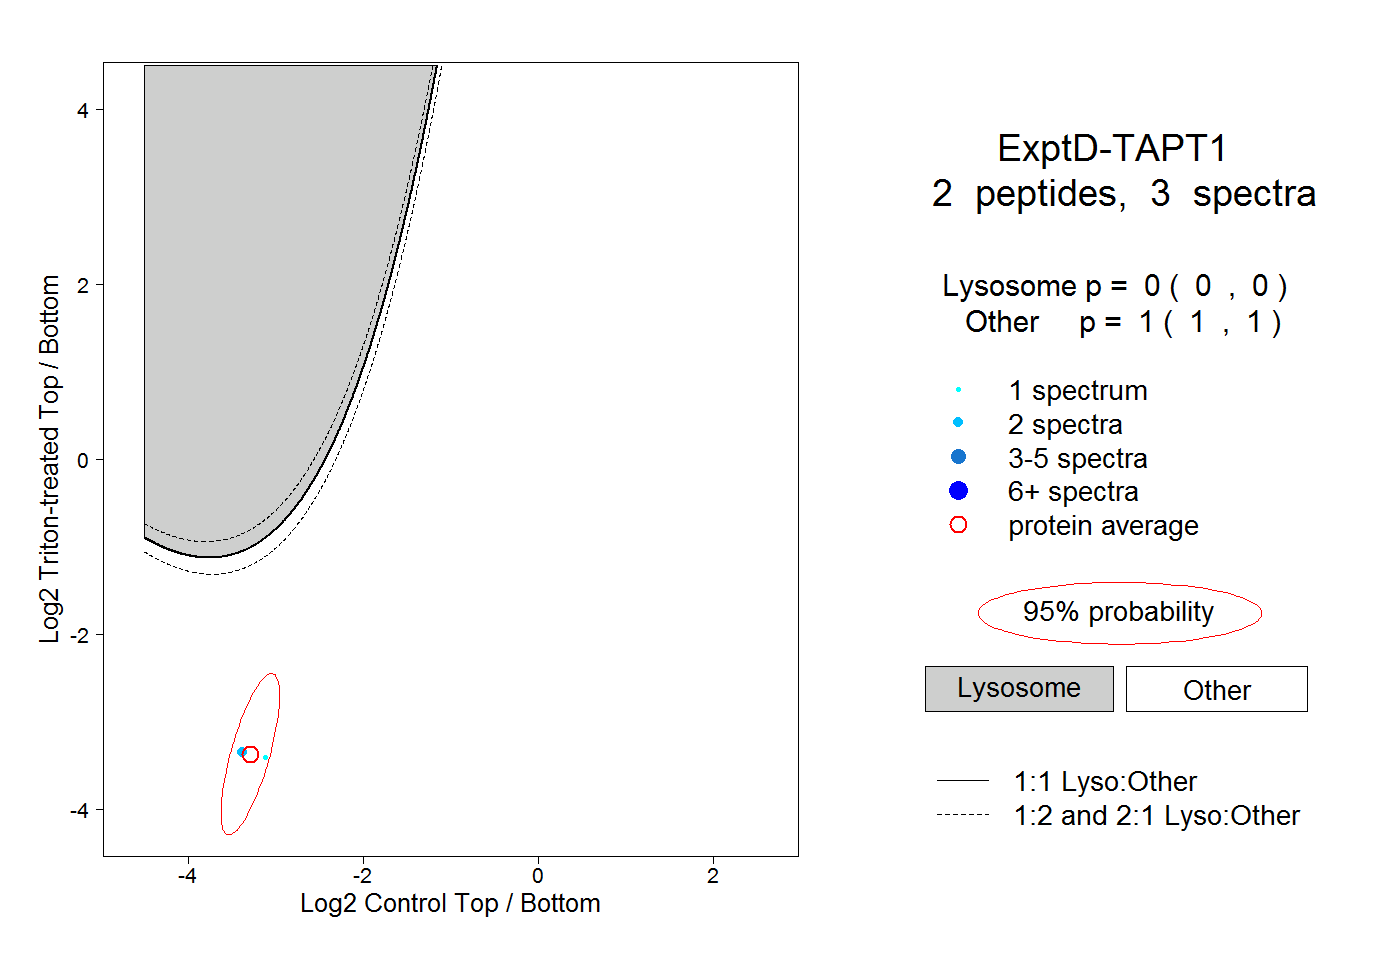
0.000 | 0.000
1.000 | 1.000