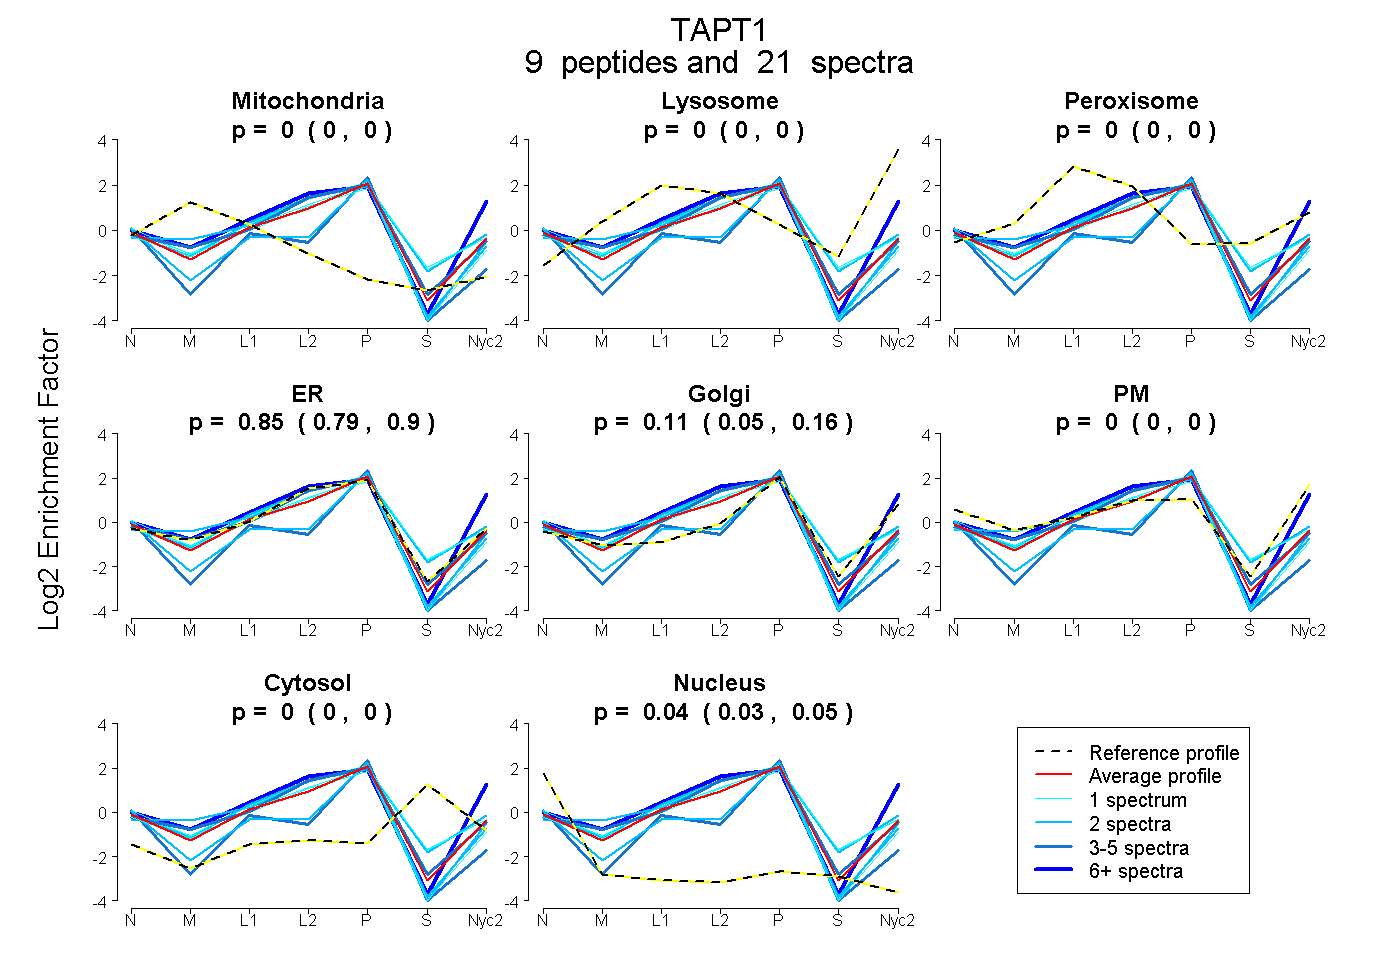
 9
9peptides
spectra
0.000 | 0.000
0.000 | 0.000
0.000 | 0.000
0.793 | 0.895
0.050 | 0.162
0.000 | 0.000
0.000 | 0.000
0.026 | 0.050
| Plot | Mito | Lyso | Perox | ER | Golgi | PM | Cytosol | Nucleus | |||||
| Expt A |
9 peptides |
21 spectra |
|
0.000 0.000 | 0.000 |
0.000 0.000 | 0.000 |
0.000 0.000 | 0.000 |
0.850 0.793 | 0.895 |
0.110 0.050 | 0.162 |
0.000 0.000 | 0.000 |
0.000 0.000 | 0.000 |
0.040 0.026 | 0.050 |
| 2 spectra, HAFITK | 0.000 | 0.000 | 0.071 | 0.856 | 0.008 | 0.000 | 0.065 | 0.000 | ||
| 1 spectrum, SCQYVK | 0.000 | 0.000 | 0.016 | 0.837 | 0.035 | 0.000 | 0.111 | 0.000 | ||
| 2 spectra, FTICGNR | 0.000 | 0.000 | 0.000 | 0.442 | 0.408 | 0.000 | 0.000 | 0.150 | ||
| 3 spectra, DLLEIDR | 0.000 | 0.000 | 0.000 | 0.637 | 0.118 | 0.000 | 0.000 | 0.245 | ||
| 3 spectra, NAYTDYSDSVAR | 0.000 | 0.000 | 0.000 | 0.989 | 0.000 | 0.000 | 0.000 | 0.011 | ||
| 6 spectra, ASLAFDLVSSR | 0.000 | 0.005 | 0.000 | 0.485 | 0.000 | 0.510 | 0.000 | 0.000 | ||
| 1 spectrum, LLTLPCYGLR | 0.000 | 0.000 | 0.000 | 0.970 | 0.000 | 0.000 | 0.000 | 0.030 | ||
| 1 spectrum, LYIIYNMLEVADR | 0.000 | 0.000 | 0.000 | 0.798 | 0.004 | 0.063 | 0.135 | 0.000 | ||
| 2 spectra, FNDITADVYSEYR | 0.037 | 0.000 | 0.000 | 0.963 | 0.000 | 0.000 | 0.000 | 0.000 |
| Plot | Mito | Lyso or Perox | ER | Golgi | PM | Cytosol | Nucleus | ||||||
| Expt B |
3 peptides |
7 spectra |
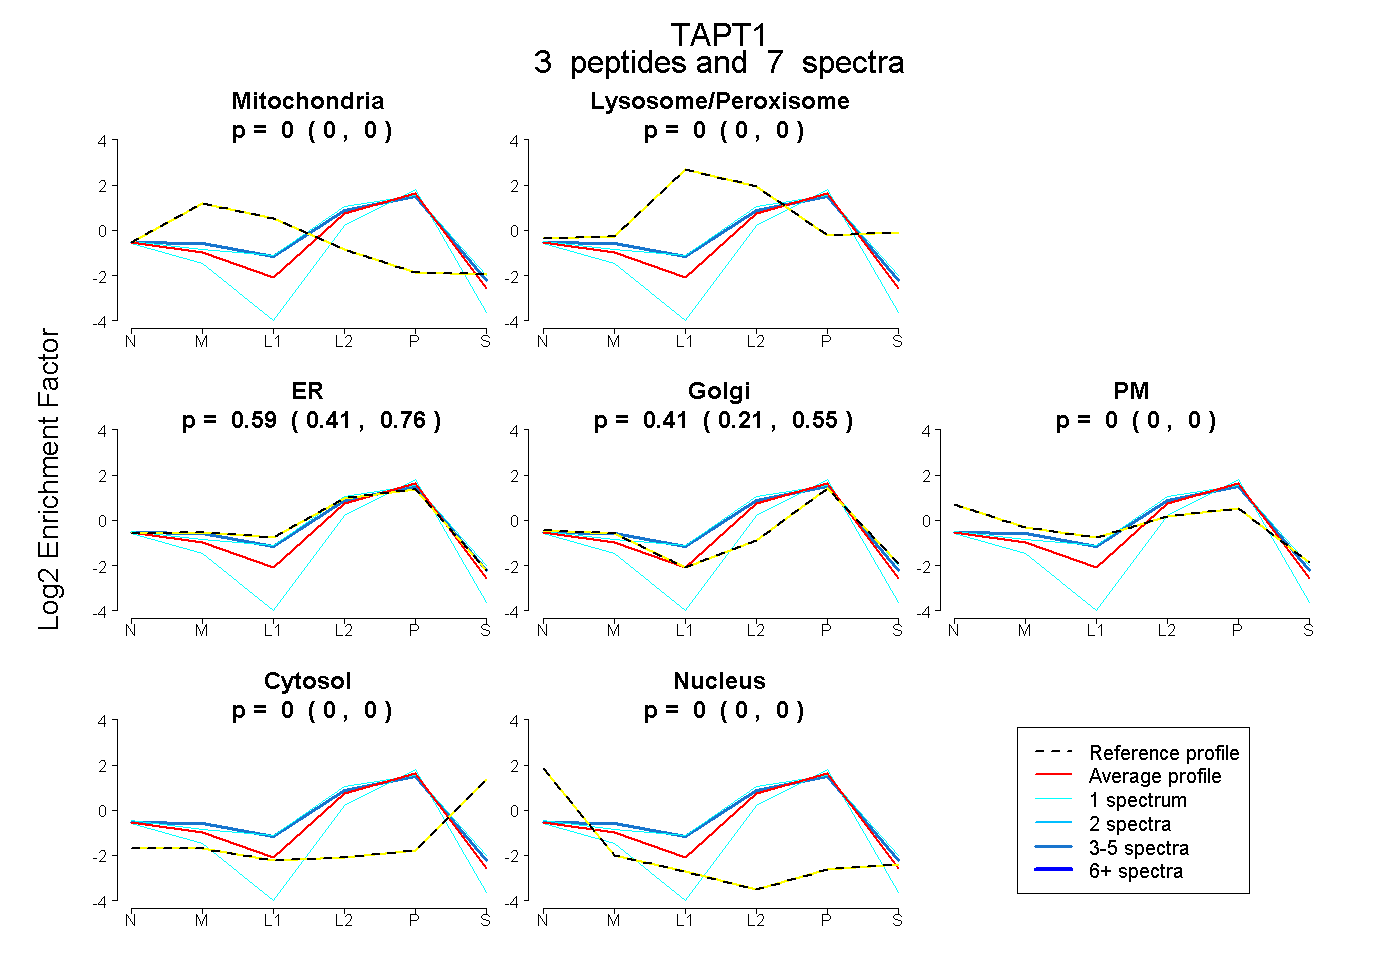 |
0.000 0.000 | 0.000 |
0.000 0.000 | 0.000 |
0.595 0.413 | 0.759 |
0.405 0.209 | 0.554 |
0.000 0.000 | 0.000 |
0.000 0.000 | 0.000 |
0.000 0.000 | 0.000 |
|||
| Plot | Lyso | Other | |||||||||||
| Expt C |
9 peptides |
23 spectra |
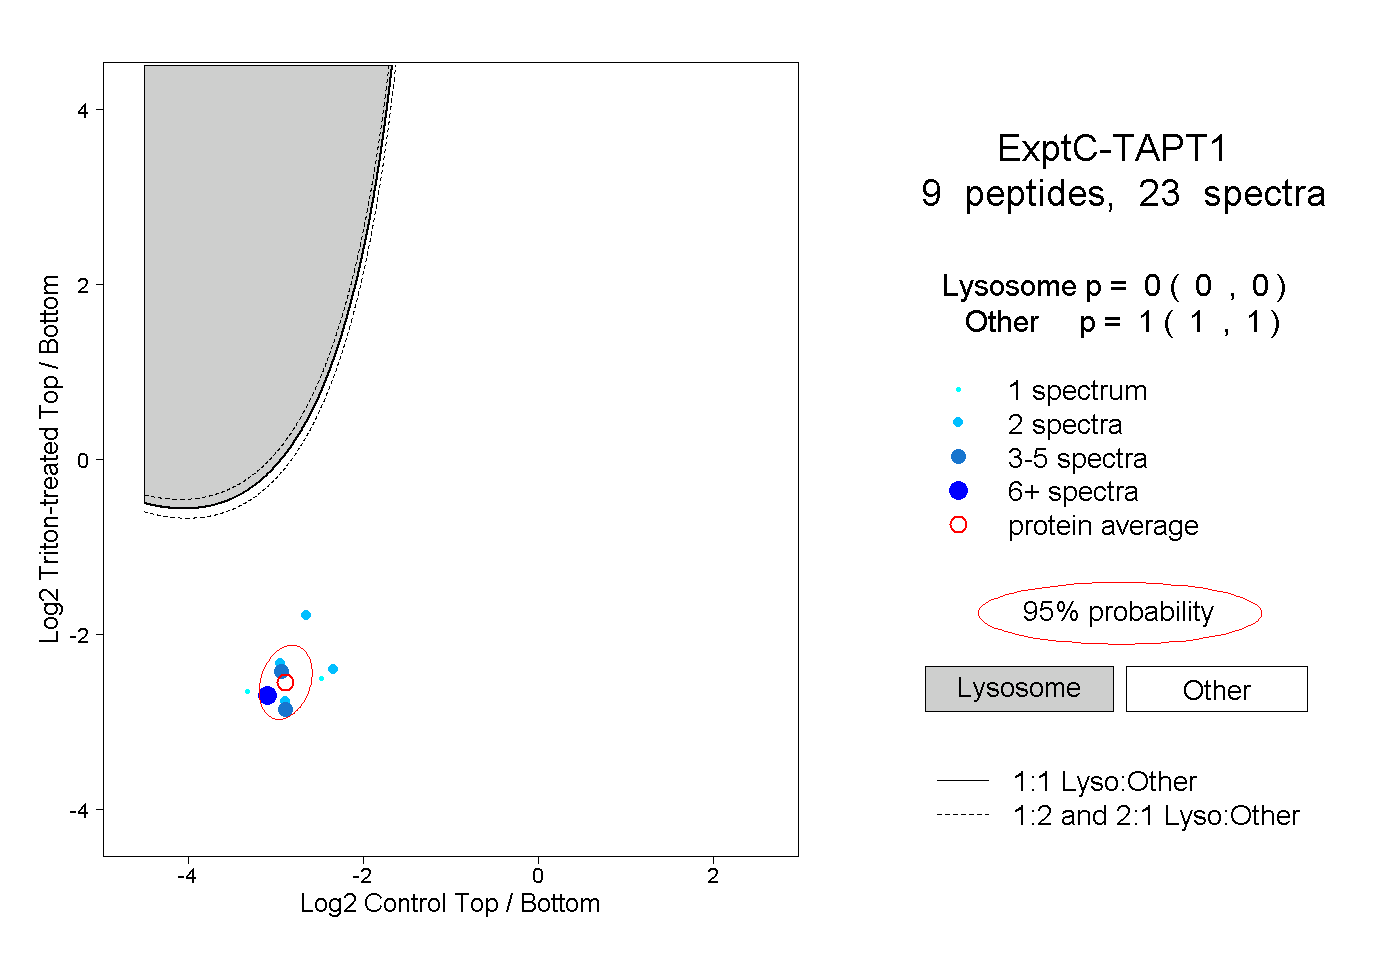 |
0.000 0.000 | 0.000 |
1.000 1.000 | 1.000 |
||||||||
| Plot | Lyso | Other | |||||||||||
| Expt D |
2 peptides |
3 spectra |
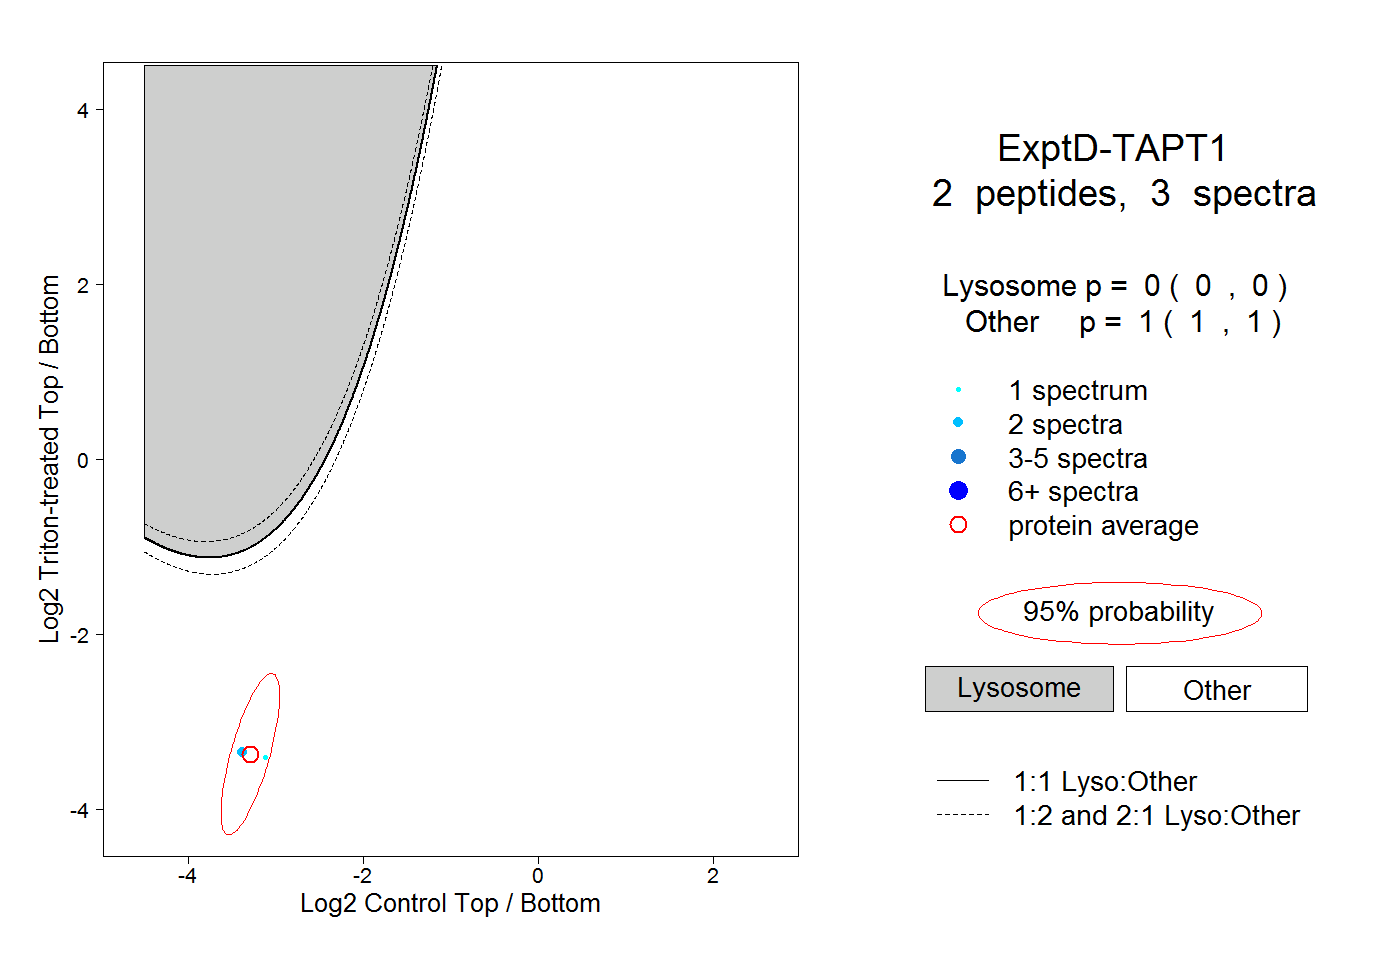 |
0.000 0.000 | 0.000 |
1.000 1.000 | 1.000 |