 12
12peptides
spectra
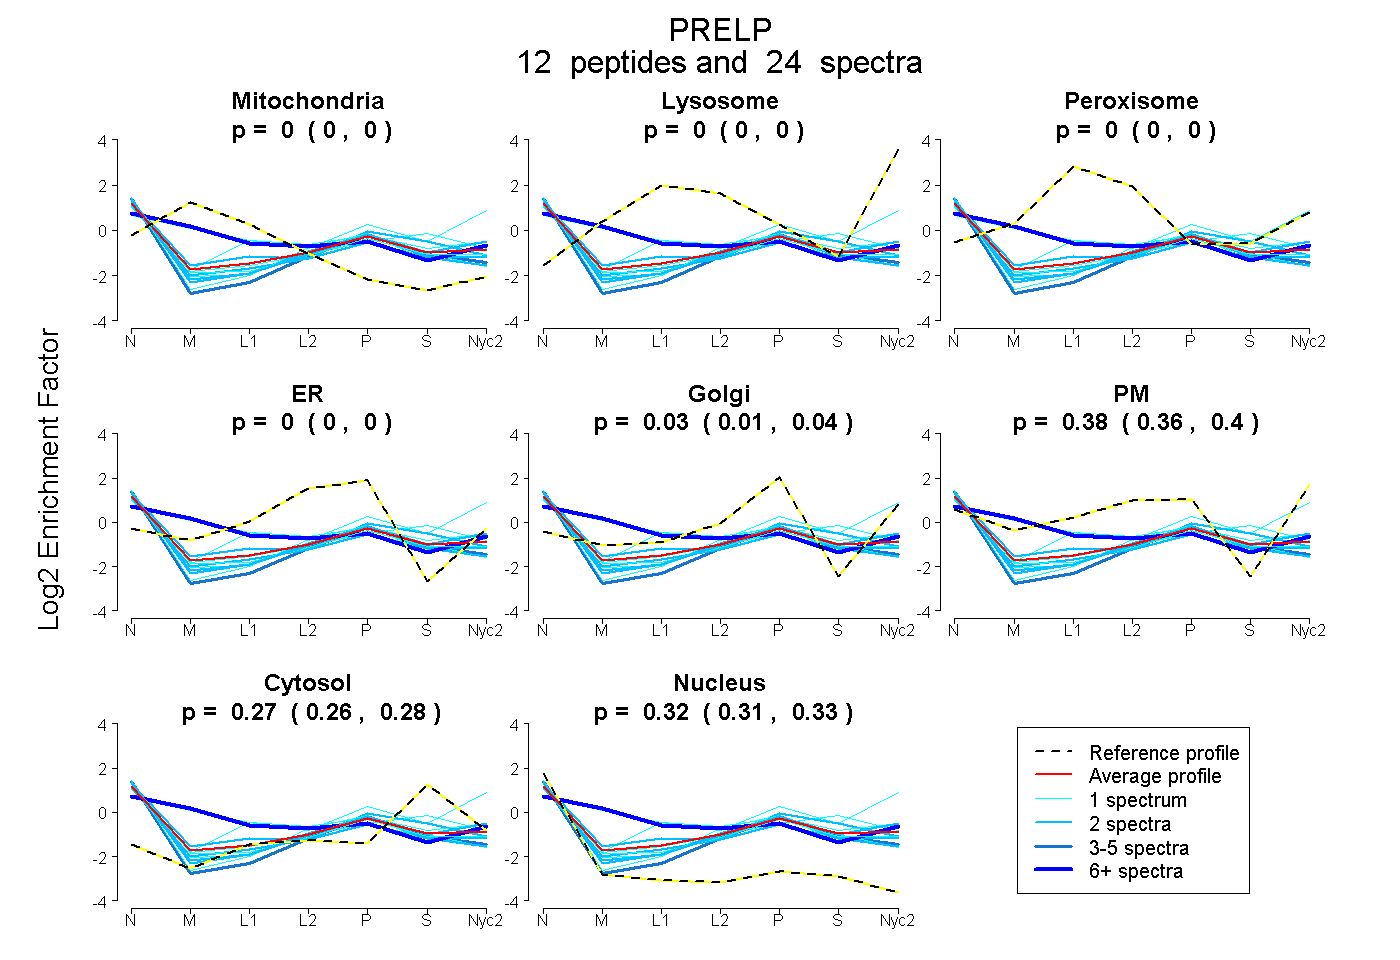
0.000 | 0.000
0.000 | 0.000
0.000 | 0.000
0.000 | 0.000
0.006 | 0.045
0.360 | 0.403
0.260 | 0.277
0.312 | 0.326
3peptides
spectra
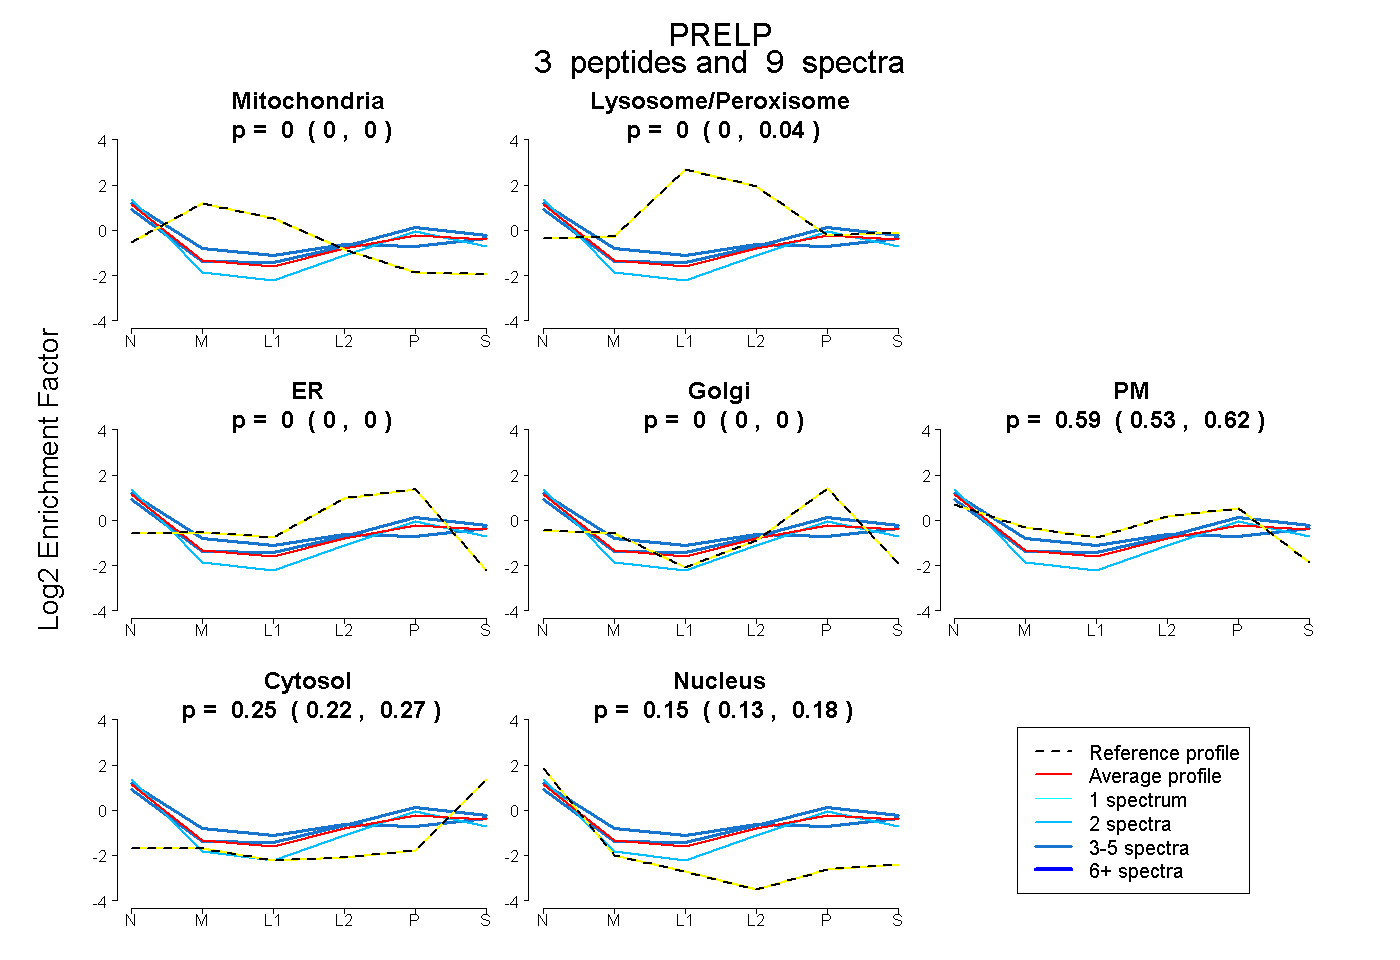
0.000 | 0.000
0.000 | 0.042
0.000 | 0.000
0.000 | 0.000
0.531 | 0.618
0.221 | 0.265
0.131 | 0.185
10peptides
spectra
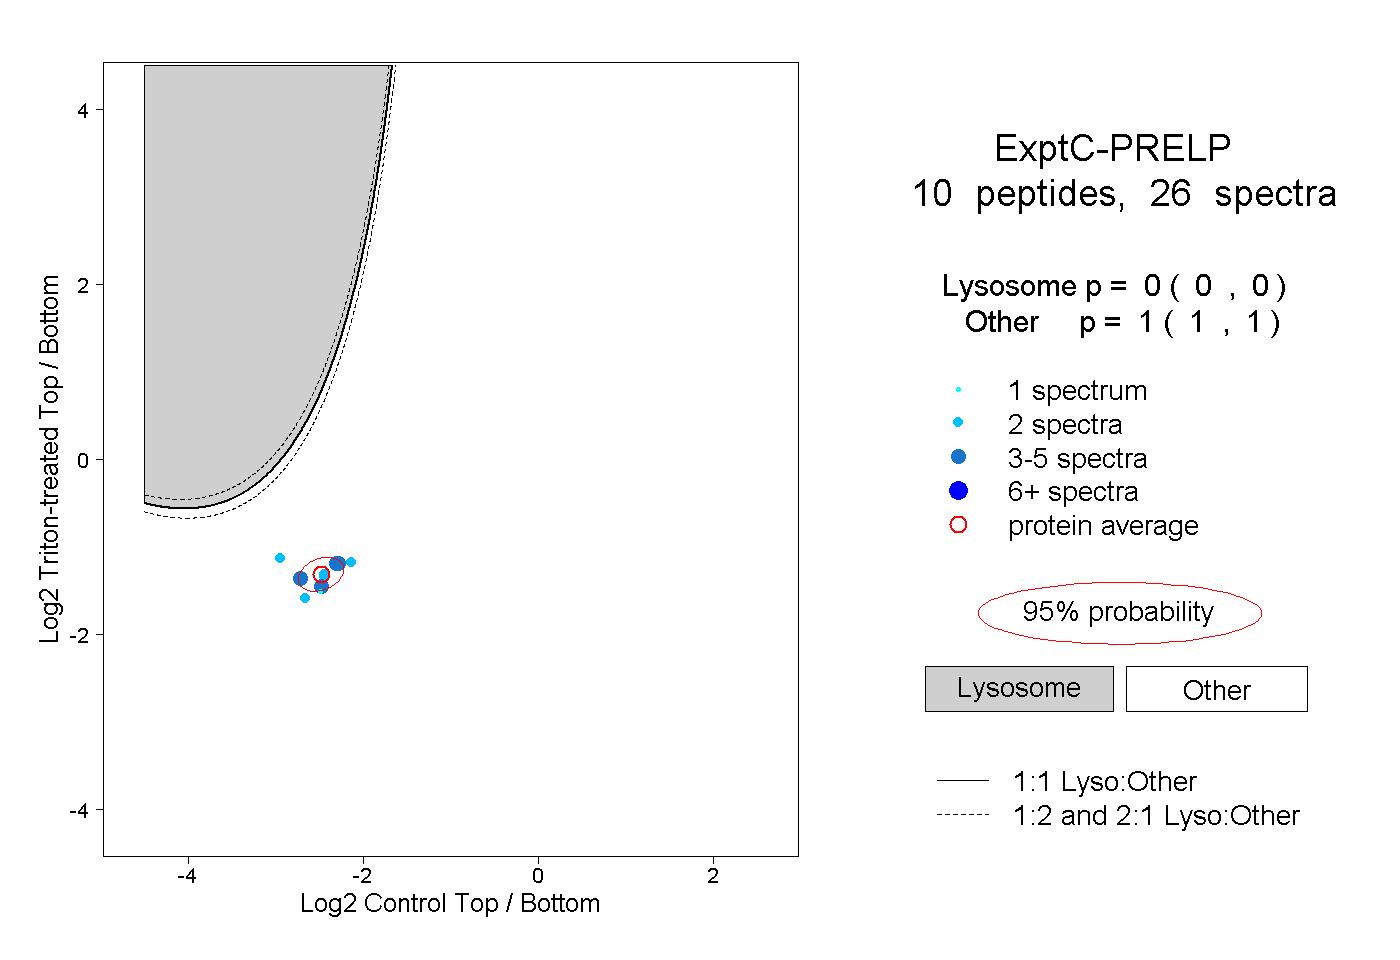
0.000 | 0.000
1.000 | 1.000
1peptide
spectra
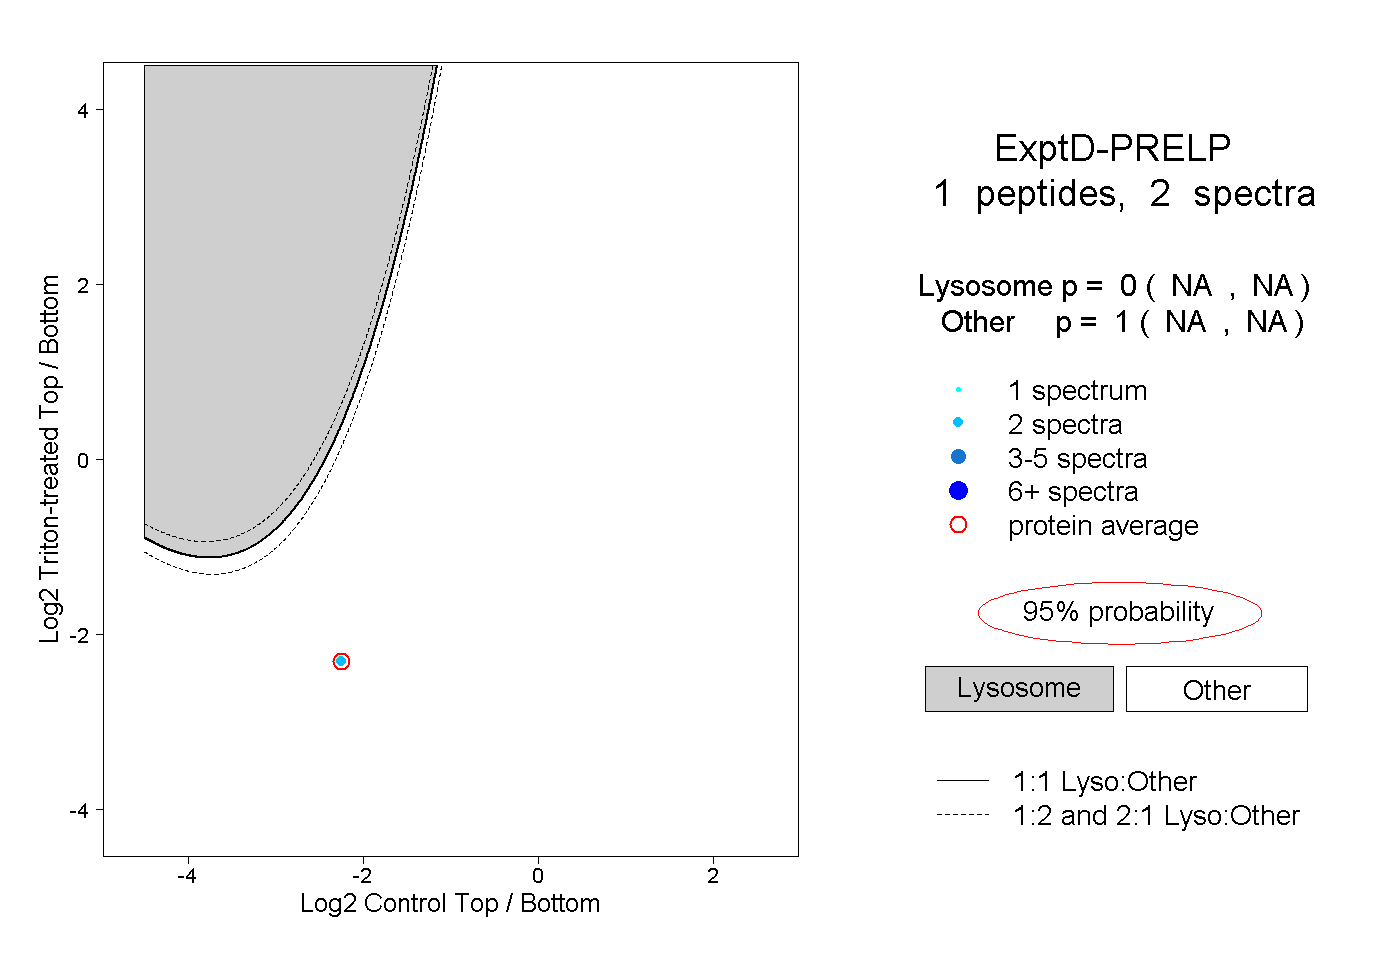
NA | NA
NA | NA