 12
12peptides
spectra
0.000 | 0.000
0.000 | 0.000
0.000 | 0.000
0.000 | 0.000
0.006 | 0.045
0.360 | 0.403
0.260 | 0.277
0.312 | 0.326
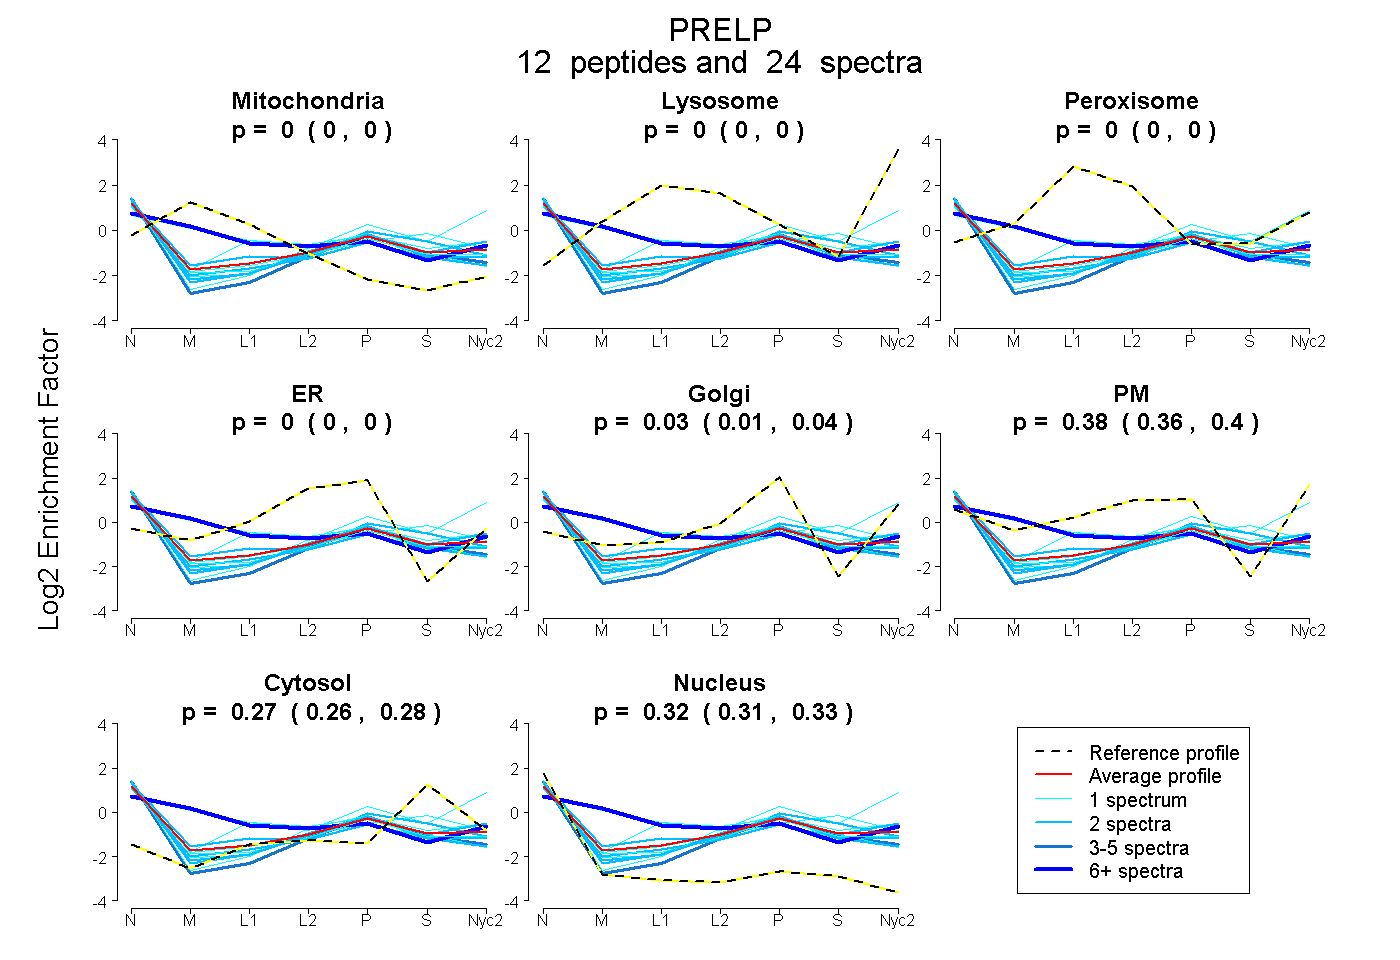
| Plot | Mito | Lyso | Perox | ER | Golgi | PM | Cytosol | Nucleus | |||||
| Expt A |
12 peptides |
24 spectra |
|
0.000 0.000 | 0.000 |
0.000 0.000 | 0.000 |
0.000 0.000 | 0.000 |
0.000 0.000 | 0.000 |
0.029 0.006 | 0.045 |
0.381 0.360 | 0.403 |
0.269 0.260 | 0.277 |
0.320 0.312 | 0.326 |
| 1 spectrum, NLEQLR | 0.300 | 0.000 | 0.000 | 0.000 | 0.000 | 0.400 | 0.260 | 0.039 | ||
| 2 spectra, WINLDNNR | 0.000 | 0.000 | 0.000 | 0.000 | 0.109 | 0.307 | 0.259 | 0.325 | ||
| 2 spectra, LSDGVFK | 0.000 | 0.000 | 0.000 | 0.000 | 0.169 | 0.187 | 0.342 | 0.302 | ||
| 1 spectrum, LSQNLISR | 0.000 | 0.000 | 0.000 | 0.000 | 0.151 | 0.288 | 0.198 | 0.363 | ||
| 1 spectrum, NQLEEVPSALPR | 0.000 | 0.000 | 0.000 | 0.000 | 0.066 | 0.318 | 0.235 | 0.381 | ||
| 1 spectrum, ISNVPAISNK | 0.000 | 0.000 | 0.000 | 0.160 | 0.061 | 0.133 | 0.245 | 0.401 | ||
| 4 spectra, DFPNLAFIR | 0.000 | 0.000 | 0.000 | 0.024 | 0.280 | 0.038 | 0.235 | 0.423 | ||
| 1 spectrum, IETIPSGYFK | 0.000 | 0.000 | 0.000 | 0.000 | 0.000 | 0.560 | 0.369 | 0.071 | ||
| 1 spectrum, ADTFQGLK | 0.000 | 0.000 | 0.000 | 0.000 | 0.000 | 0.307 | 0.442 | 0.251 | ||
| 2 spectra, IPPGVFSK | 0.000 | 0.000 | 0.000 | 0.051 | 0.115 | 0.225 | 0.222 | 0.387 | ||
| 2 spectra, LPGLAFLYMDK | 0.000 | 0.000 | 0.090 | 0.085 | 0.000 | 0.218 | 0.182 | 0.425 | ||
| 6 spectra, NLMQLNLAHNILR | 0.347 | 0.000 | 0.000 | 0.000 | 0.000 | 0.389 | 0.165 | 0.100 |
| Plot | Mito | Lyso or Perox | ER | Golgi | PM | Cytosol | Nucleus | ||||||
| Expt B |
3 peptides |
9 spectra |
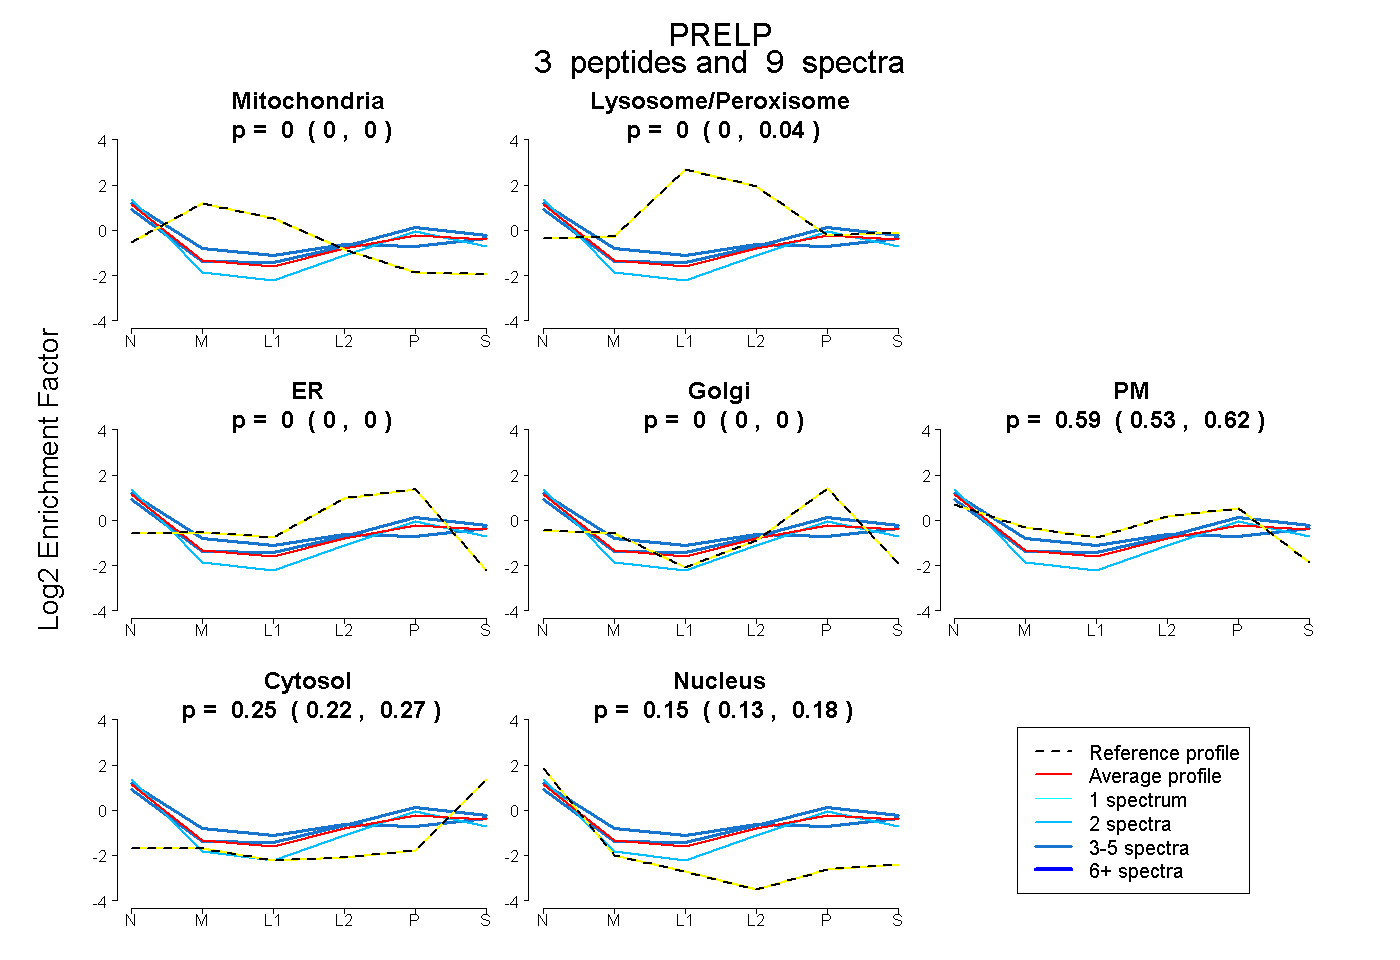 |
0.000 0.000 | 0.000 |
0.000 0.000 | 0.042 |
0.000 0.000 | 0.000 |
0.000 0.000 | 0.000 |
0.595 0.531 | 0.618 |
0.251 0.221 | 0.265 |
0.154 0.131 | 0.185 |
|||
| Plot | Lyso | Other | |||||||||||
| Expt C |
10 peptides |
26 spectra |
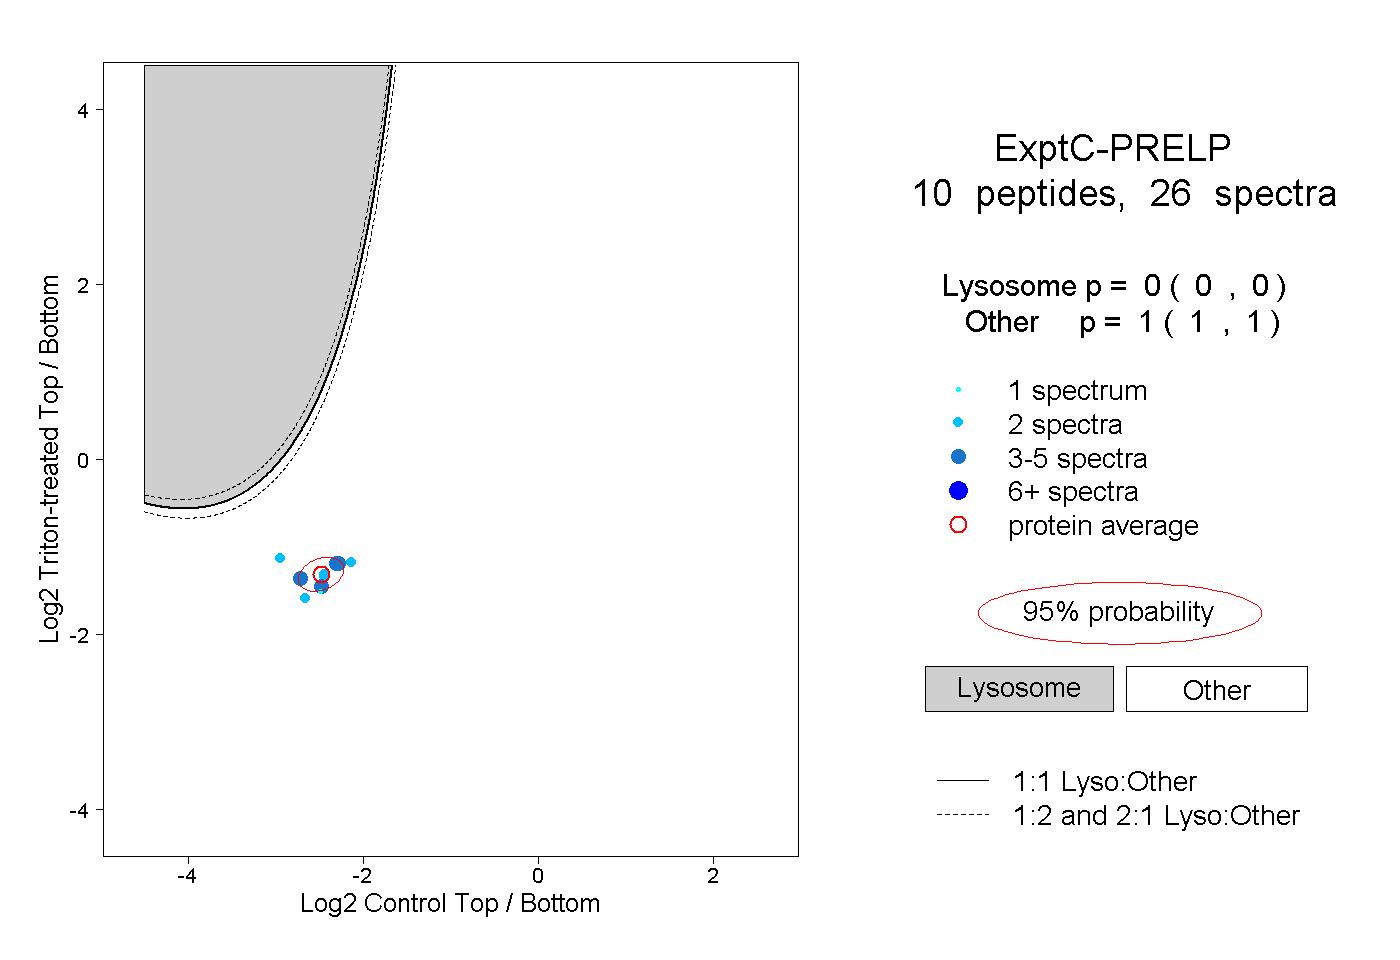 |
0.000 0.000 | 0.000 |
1.000 1.000 | 1.000 |
||||||||
| Plot | Lyso | Other | |||||||||||
| Expt D |
1 peptide |
2 spectra |
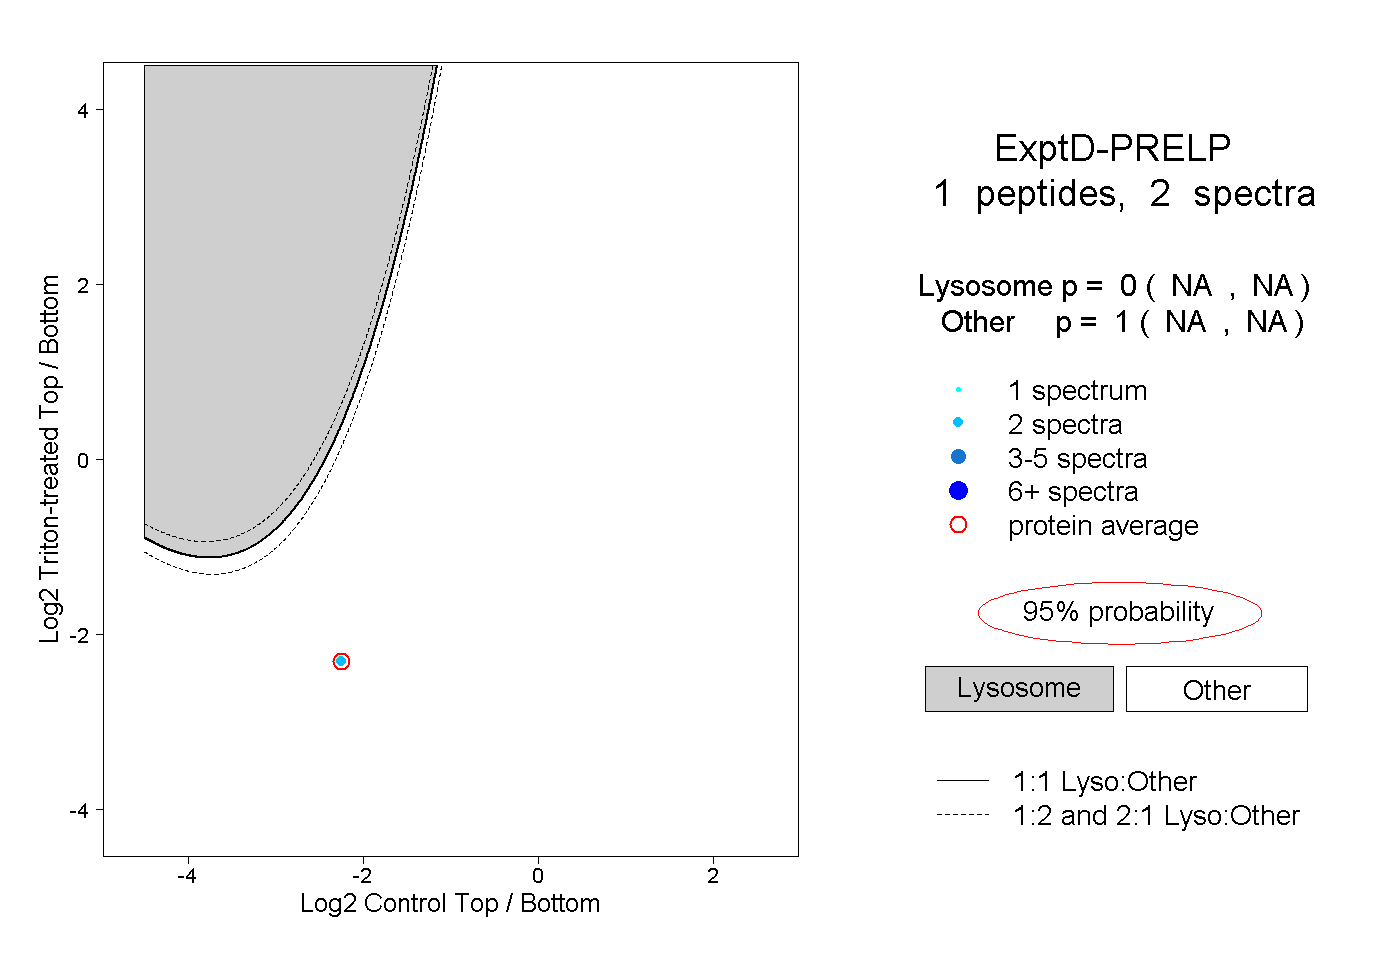 |
0.000 NA | NA |
1.000 NA | NA |