 6
6peptides
spectra
0.000 | 0.017
0.000 | 0.000
0.000 | 0.000
0.000 | 0.088
0.000 | 0.113
0.000 | 0.000
0.847 | 0.870
0.016 | 0.073
2peptides
spectra
0.000 | 0.000
1.000 | 1.000
| Plot | Mito | Lyso | Perox | ER | Golgi | PM | Cytosol | Nucleus | |||||
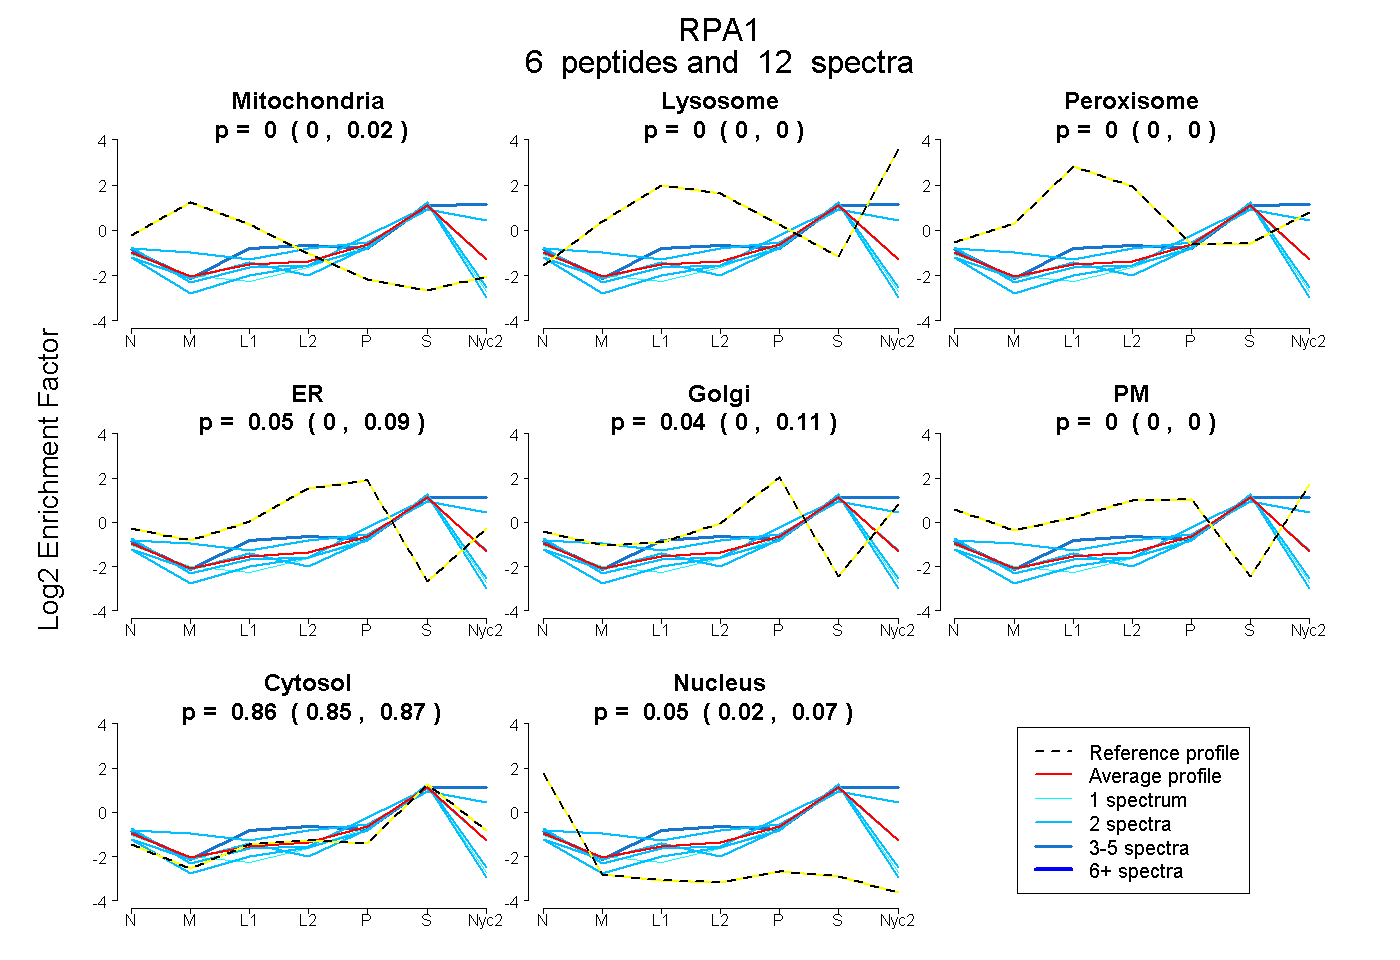
| Expt A |
6 peptides |
12 spectra |
|
0.000 0.000 | 0.017 |
0.000 0.000 | 0.000 |
0.000 0.000 | 0.000 |
0.051 0.000 | 0.088 |
0.039 0.000 | 0.113 |
0.000 0.000 | 0.000 |
0.862 0.847 | 0.870 |
0.047 0.016 | 0.073 |
||
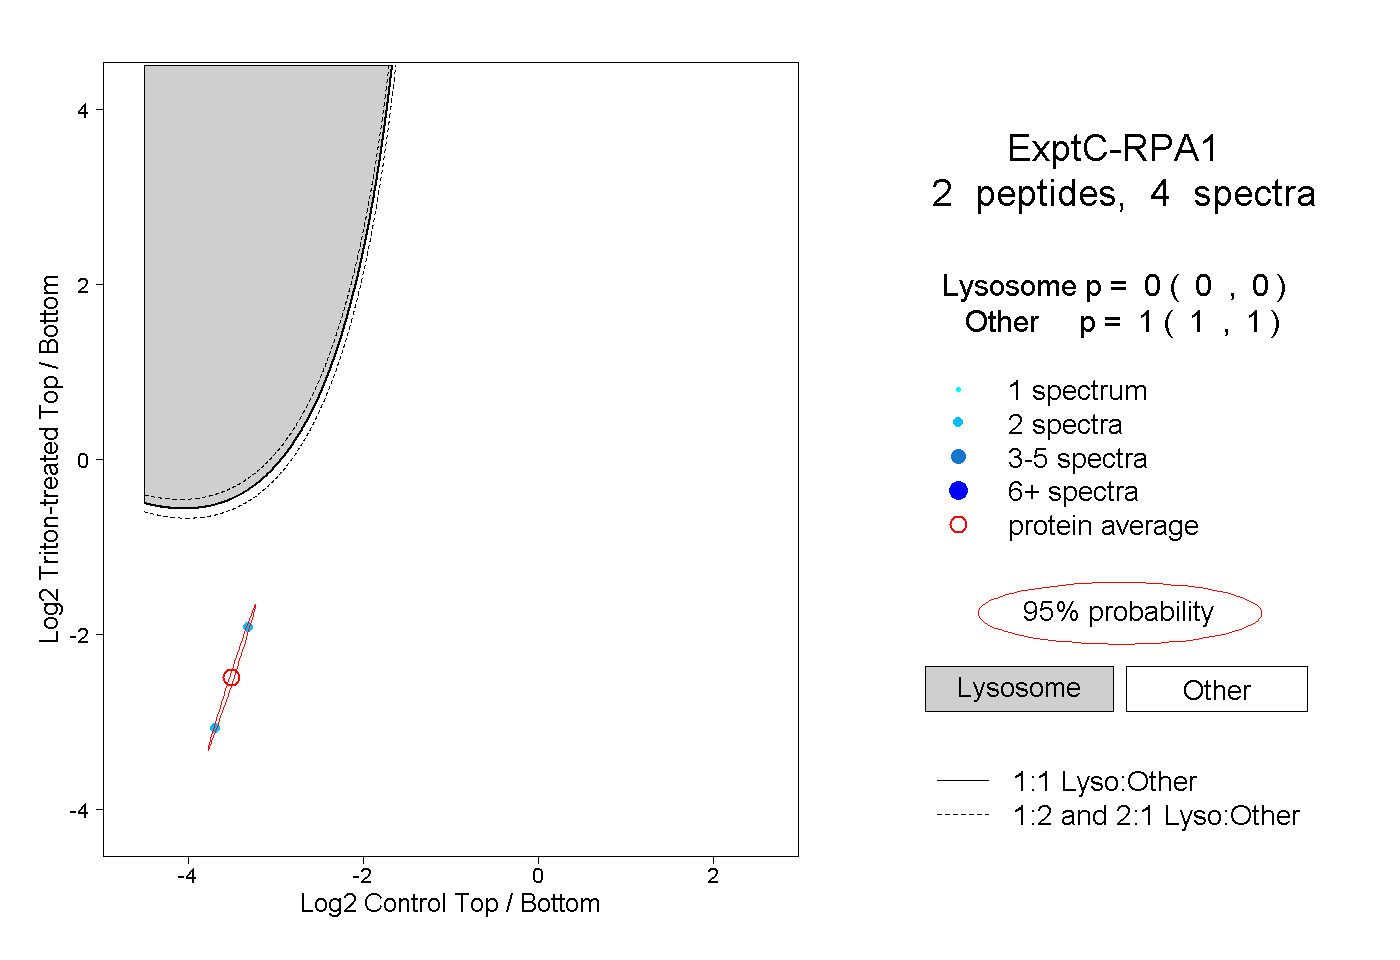
| Plot | Lyso | Other | |||||||||||
| Expt C |
2 peptides |
4 spectra |
|
0.000 0.000 | 0.000 |
1.000 1.000 | 1.000 |