 6
6peptides
spectra
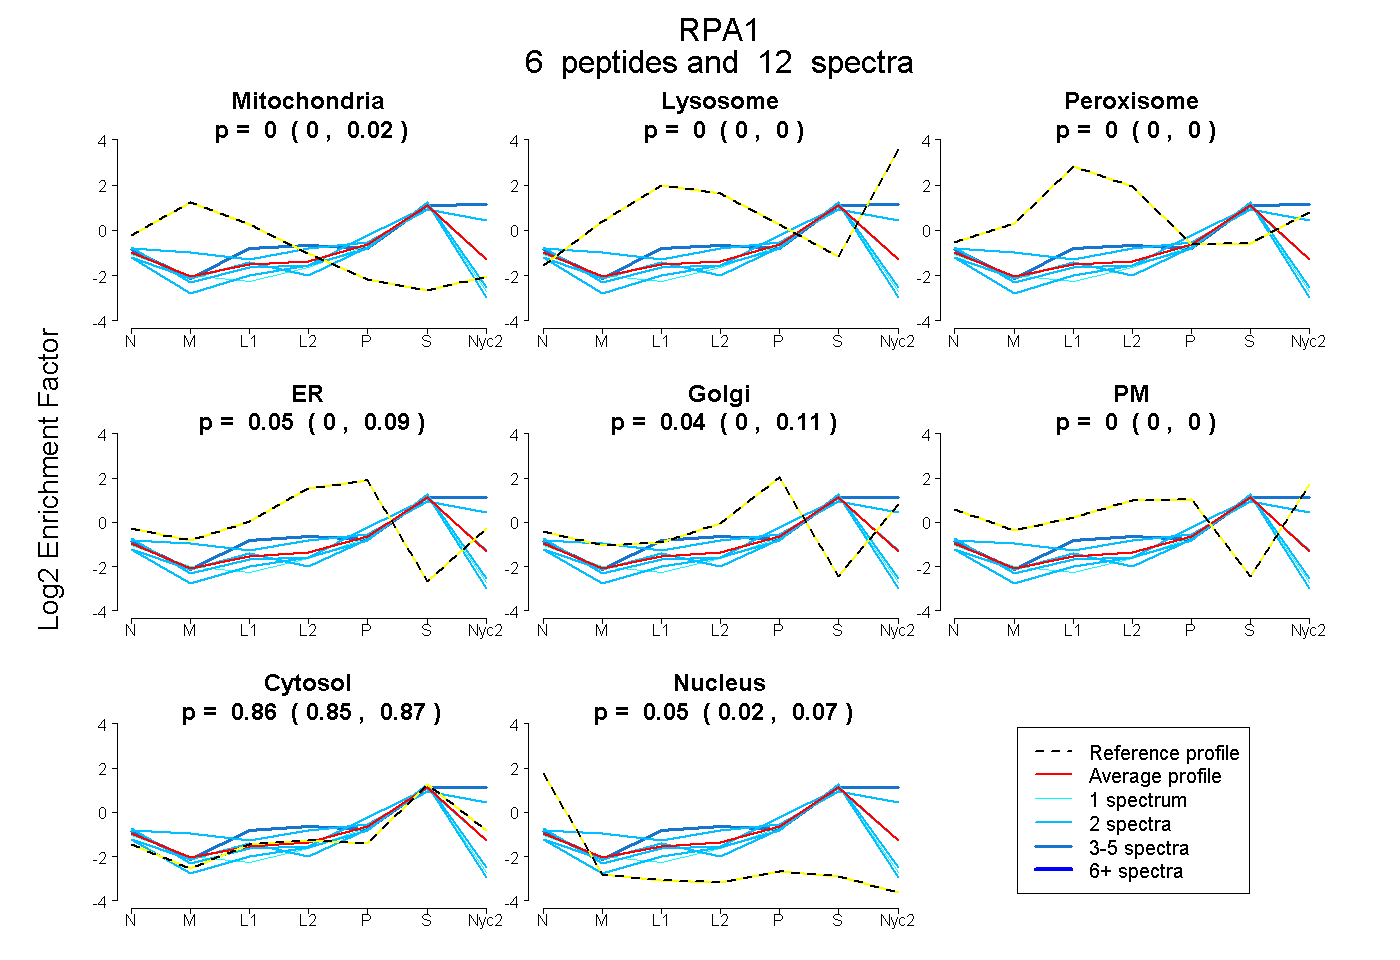
0.000 | 0.017
0.000 | 0.000
0.000 | 0.000
0.000 | 0.088
0.000 | 0.113
0.000 | 0.000
0.847 | 0.870
0.016 | 0.073
| Plot | Mito | Lyso | Perox | ER | Golgi | PM | Cytosol | Nucleus | |||||
| Expt A |
6 peptides |
12 spectra |
|
0.000 0.000 | 0.017 |
0.000 0.000 | 0.000 |
0.000 0.000 | 0.000 |
0.051 0.000 | 0.088 |
0.039 0.000 | 0.113 |
0.000 0.000 | 0.000 |
0.862 0.847 | 0.870 |
0.047 0.016 | 0.073 |
| 3 spectra, ATAFNEQVDK | 0.000 | 0.255 | 0.000 | 0.000 | 0.000 | 0.016 | 0.730 | 0.000 | ||
| 2 spectra, WTICAR | 0.000 | 0.000 | 0.000 | 0.000 | 0.000 | 0.000 | 0.856 | 0.144 | ||
| 2 spectra, LFPNLR | 0.020 | 0.000 | 0.000 | 0.000 | 0.000 | 0.000 | 0.820 | 0.161 | ||
| 2 spectra, VYYFSK | 0.000 | 0.000 | 0.000 | 0.000 | 0.126 | 0.000 | 0.808 | 0.066 | ||
| 2 spectra, FFPLIEVNK | 0.000 | 0.129 | 0.000 | 0.000 | 0.009 | 0.155 | 0.706 | 0.000 | ||
| 1 spectrum, DSLVDIIGICK | 0.000 | 0.000 | 0.000 | 0.000 | 0.000 | 0.000 | 0.819 | 0.181 |
| Plot | Lyso | Other | |||||||||||
| Expt C |
2 peptides |
4 spectra |
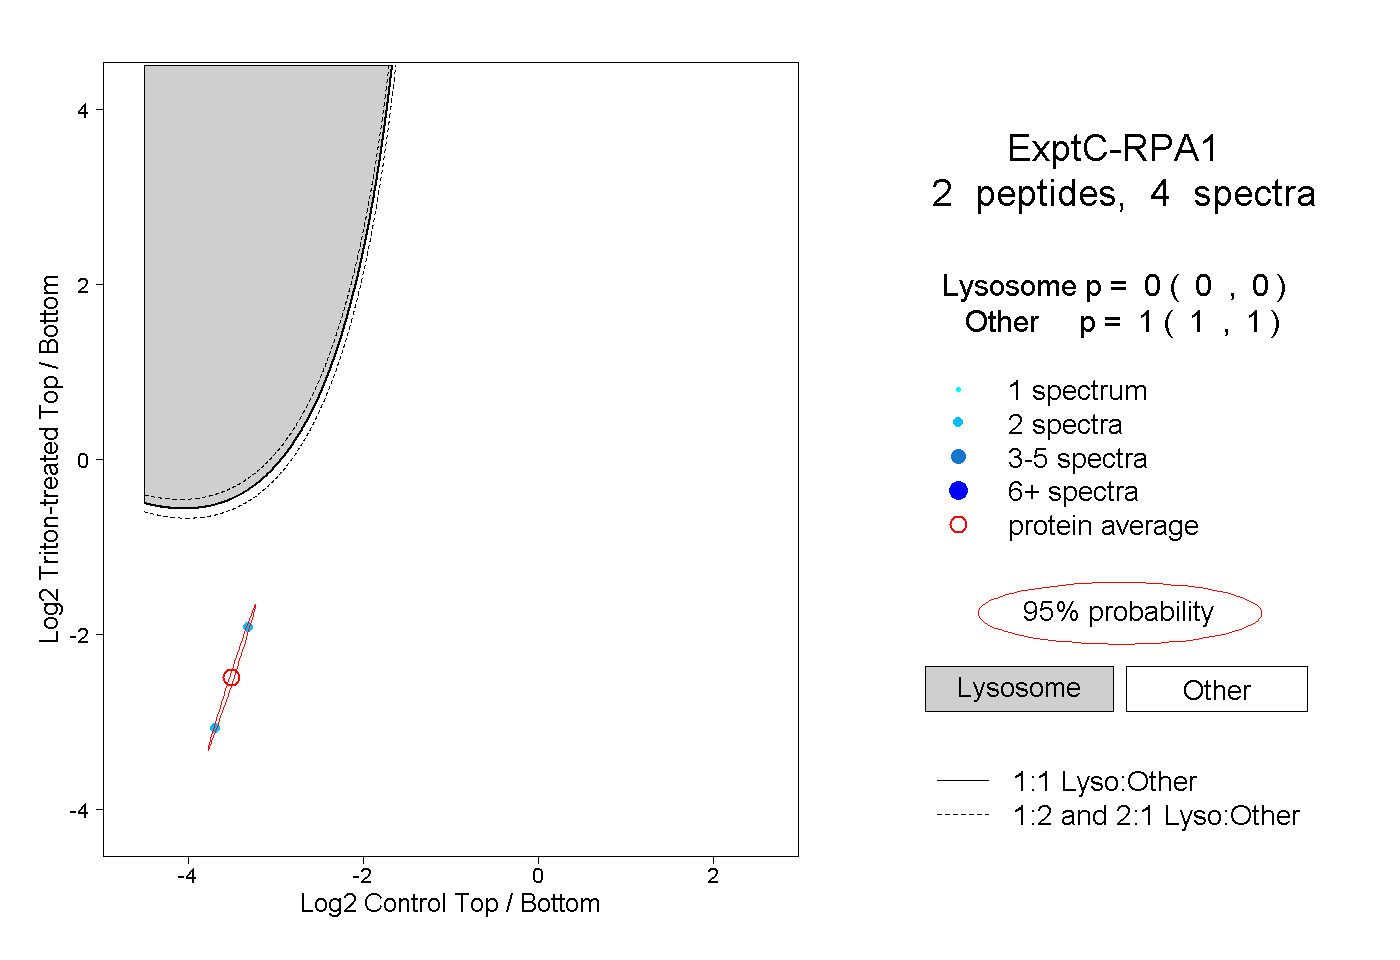 |
0.000 0.000 | 0.000 |
1.000 1.000 | 1.000 |