 5
5peptides
spectra
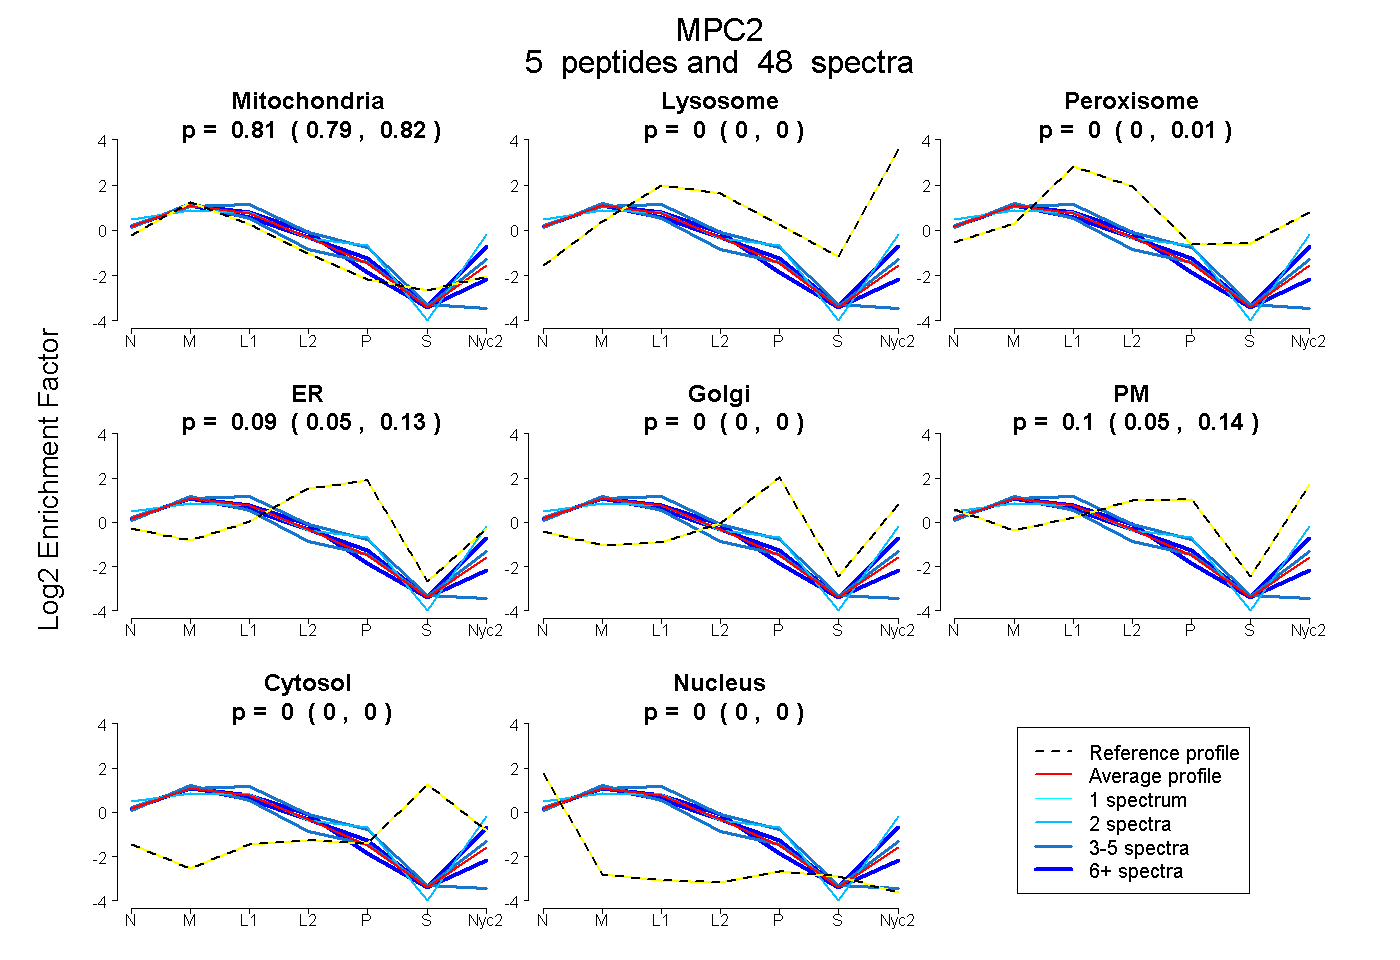
0.791 | 0.818
0.000 | 0.000
0.000 | 0.007
0.051 | 0.127
0.000 | 0.000
0.047 | 0.144
0.000 | 0.000
0.000 | 0.000
2peptides
spectra
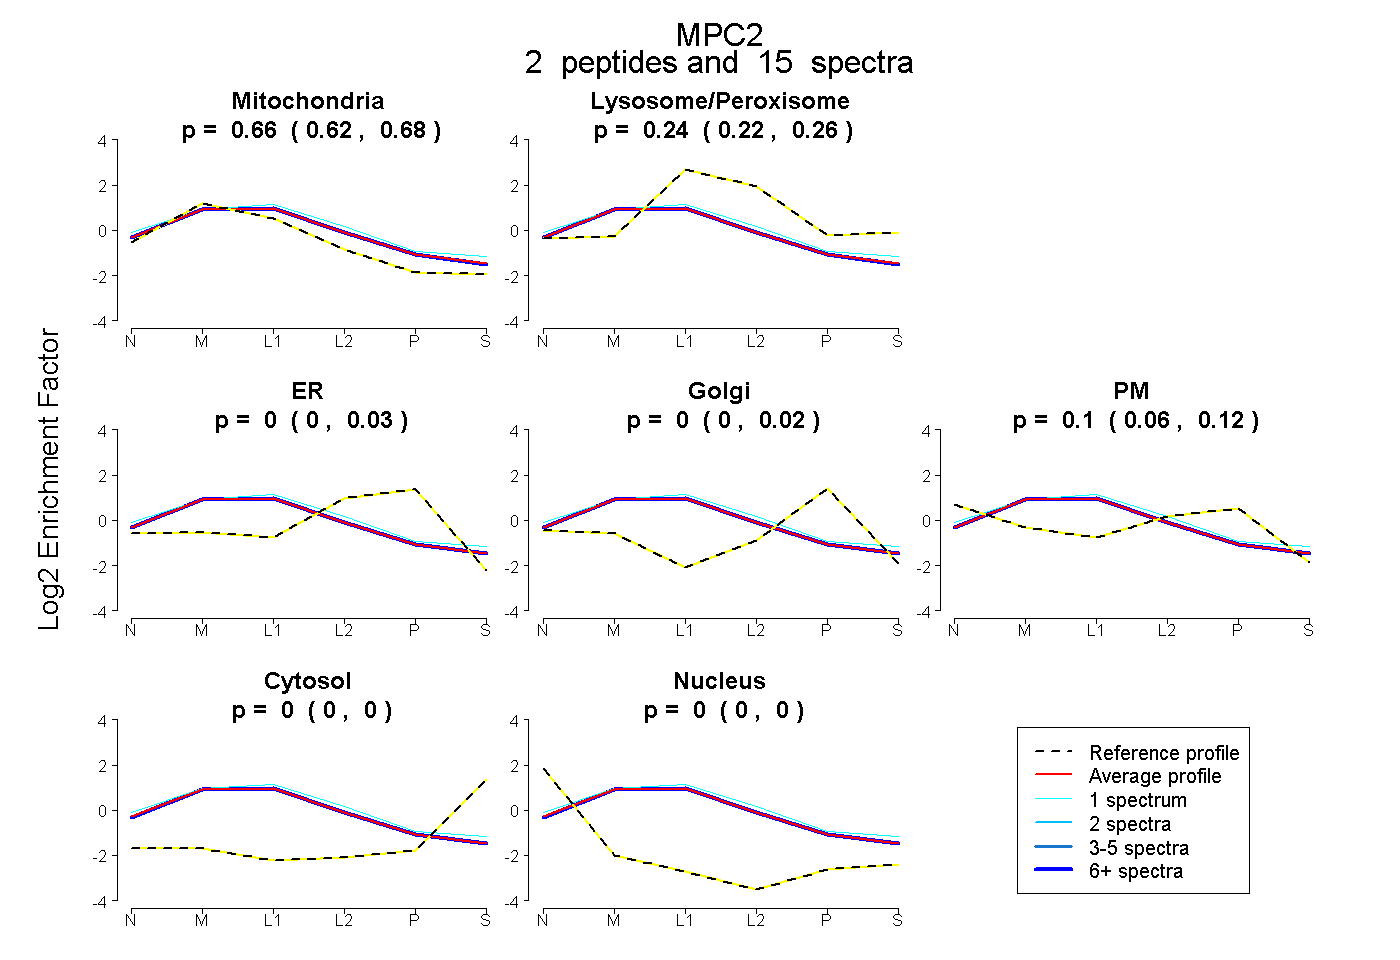
0.623 | 0.684
0.219 | 0.260
0.000 | 0.030
0.000 | 0.023
0.060 | 0.115
0.000 | 0.000
0.000 | 0.000
6peptides
spectra
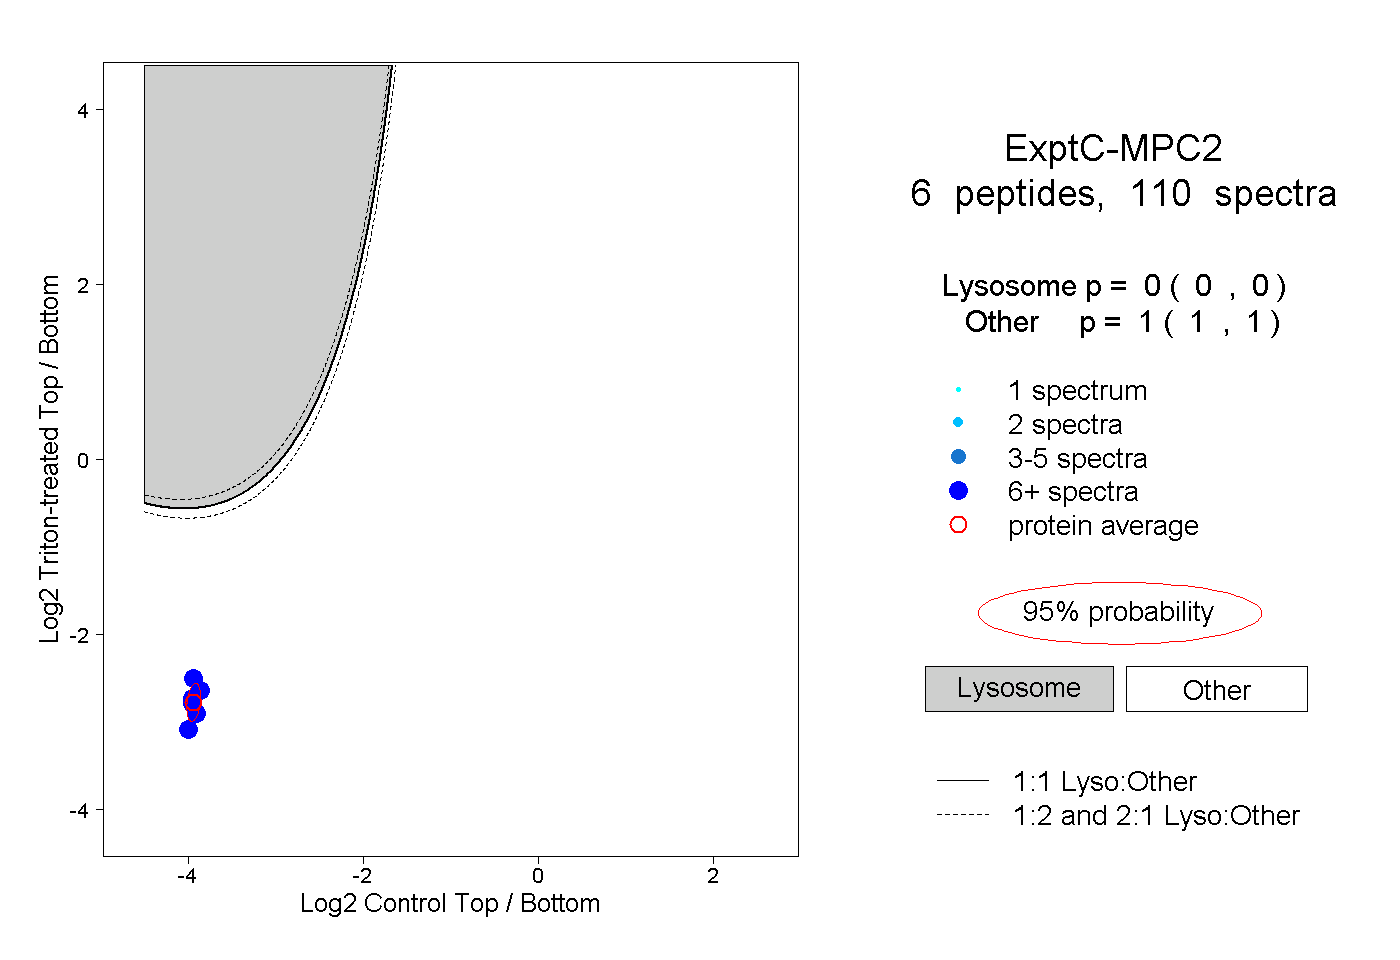
0.000 | 0.000
1.000 | 1.000