 5
5peptides
spectra
0.791 | 0.818
0.000 | 0.000
0.000 | 0.007
0.051 | 0.127
0.000 | 0.000
0.047 | 0.144
0.000 | 0.000
0.000 | 0.000
| Plot | Mito | Lyso | Perox | ER | Golgi | PM | Cytosol | Nucleus | |||||
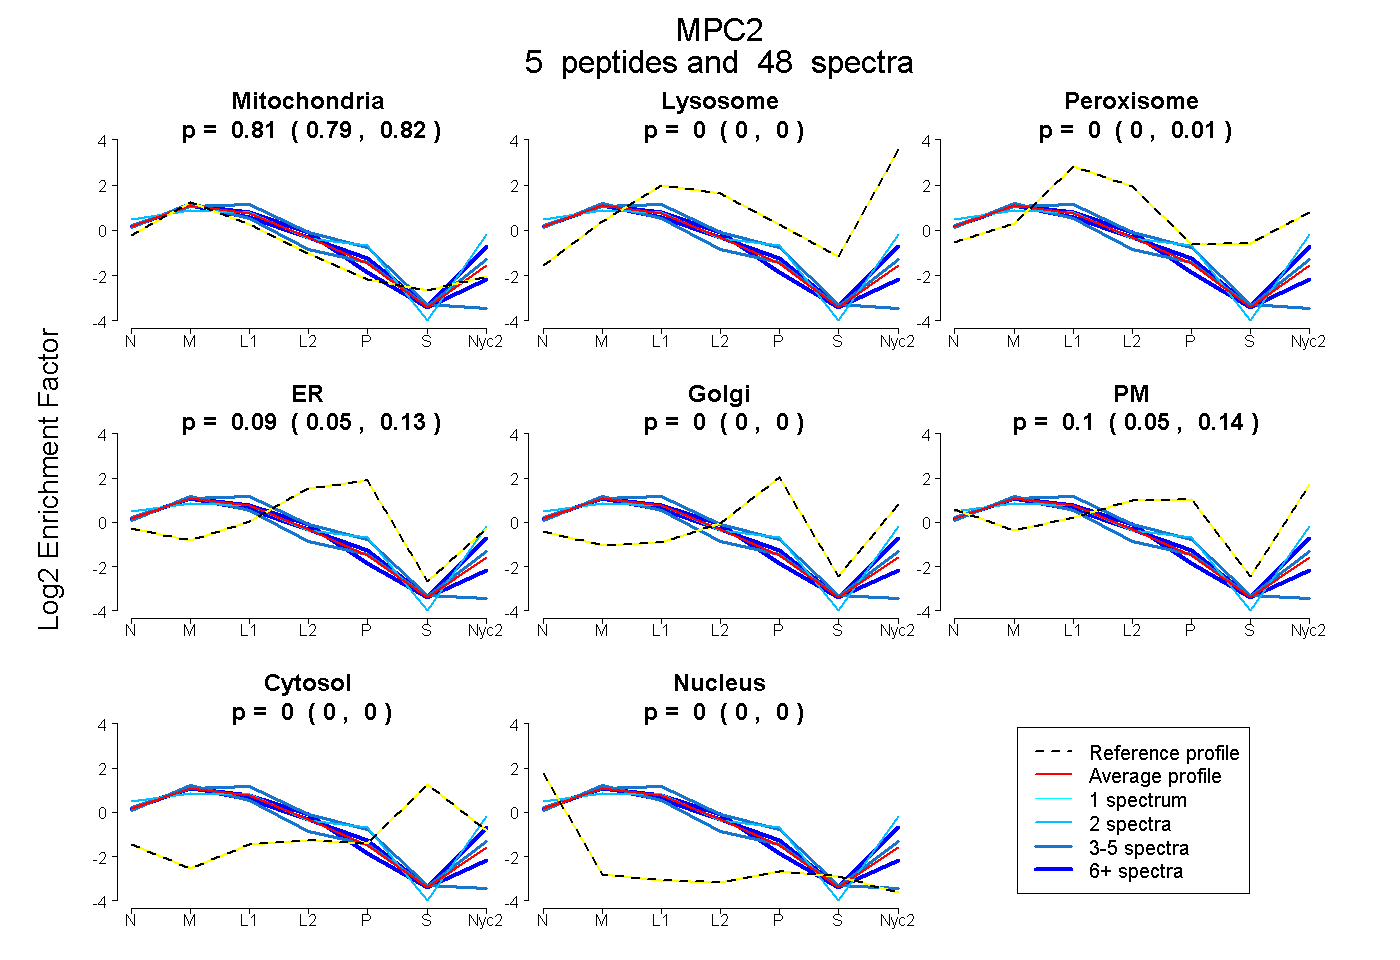
| Expt A |
5 peptides |
48 spectra |
|
0.806 0.791 | 0.818 |
0.000 0.000 | 0.000 |
0.000 0.000 | 0.007 |
0.093 0.051 | 0.127 |
0.000 0.000 | 0.000 |
0.101 0.047 | 0.144 |
0.000 0.000 | 0.000 |
0.000 0.000 | 0.000 |
| 16 spectra, TVFFWAPIMK | 0.693 | 0.000 | 0.000 | 0.000 | 0.000 | 0.307 | 0.000 | 0.000 | ||
| 3 spectra, WGLVCAGLADMARPAEK | 0.812 | 0.000 | 0.000 | 0.188 | 0.000 | 0.000 | 0.000 | 0.000 | ||
| 22 spectra, LRPLYNHPAGPR | 0.875 | 0.000 | 0.014 | 0.111 | 0.000 | 0.000 | 0.000 | 0.000 | ||
| 2 spectra, YSLVIIPK | 0.557 | 0.000 | 0.000 | 0.000 | 0.000 | 0.443 | 0.000 | 0.000 | ||
| 5 spectra, YNQELK | 0.819 | 0.000 | 0.000 | 0.000 | 0.000 | 0.181 | 0.000 | 0.000 |
| Plot | Mito | Lyso or Perox | ER | Golgi | PM | Cytosol | Nucleus | ||||||
| Expt B |
2 peptides |
15 spectra |
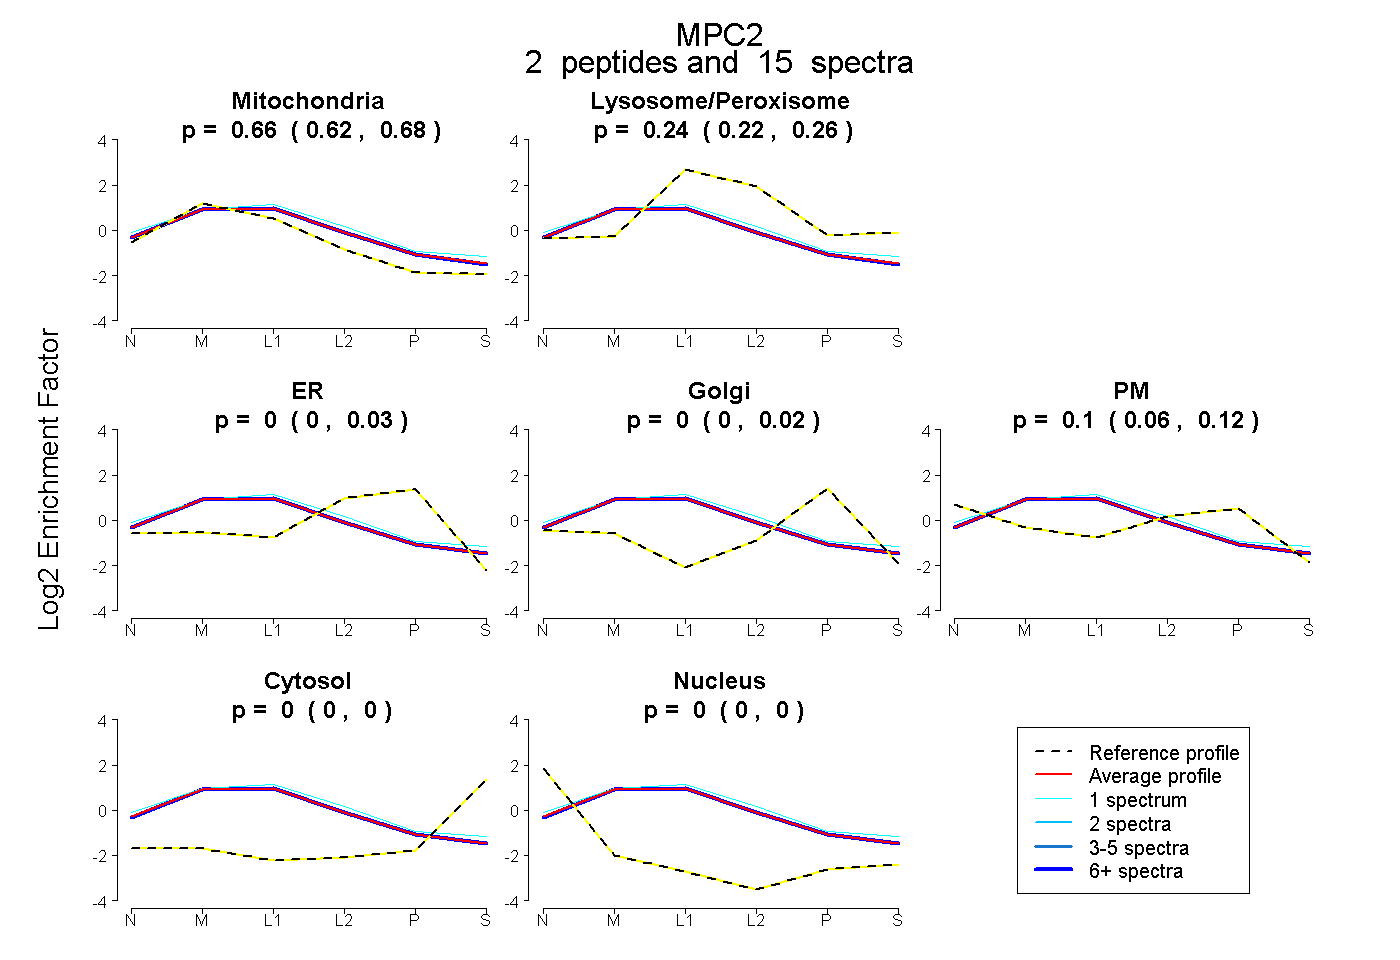 |
0.655 0.623 | 0.684 |
0.241 0.219 | 0.260 |
0.000 0.000 | 0.030 |
0.000 0.000 | 0.023 |
0.104 0.060 | 0.115 |
0.000 0.000 | 0.000 |
0.000 0.000 | 0.000 |
|||
| Plot | Lyso | Other | |||||||||||
| Expt C |
6 peptides |
110 spectra |
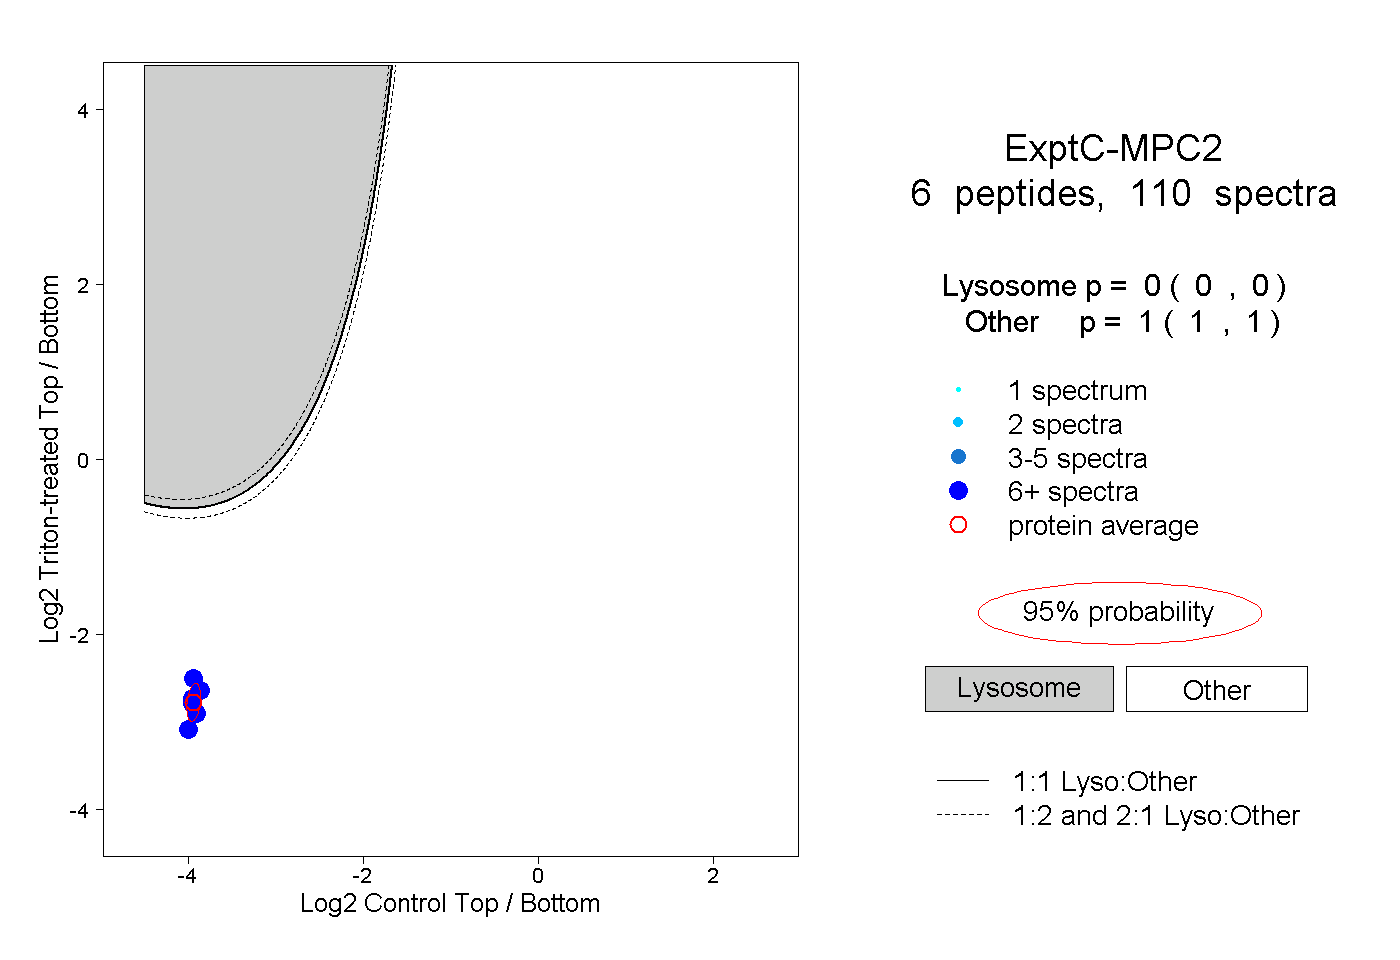 |
0.000 0.000 | 0.000 |
1.000 1.000 | 1.000 |