 3
3peptides
spectra
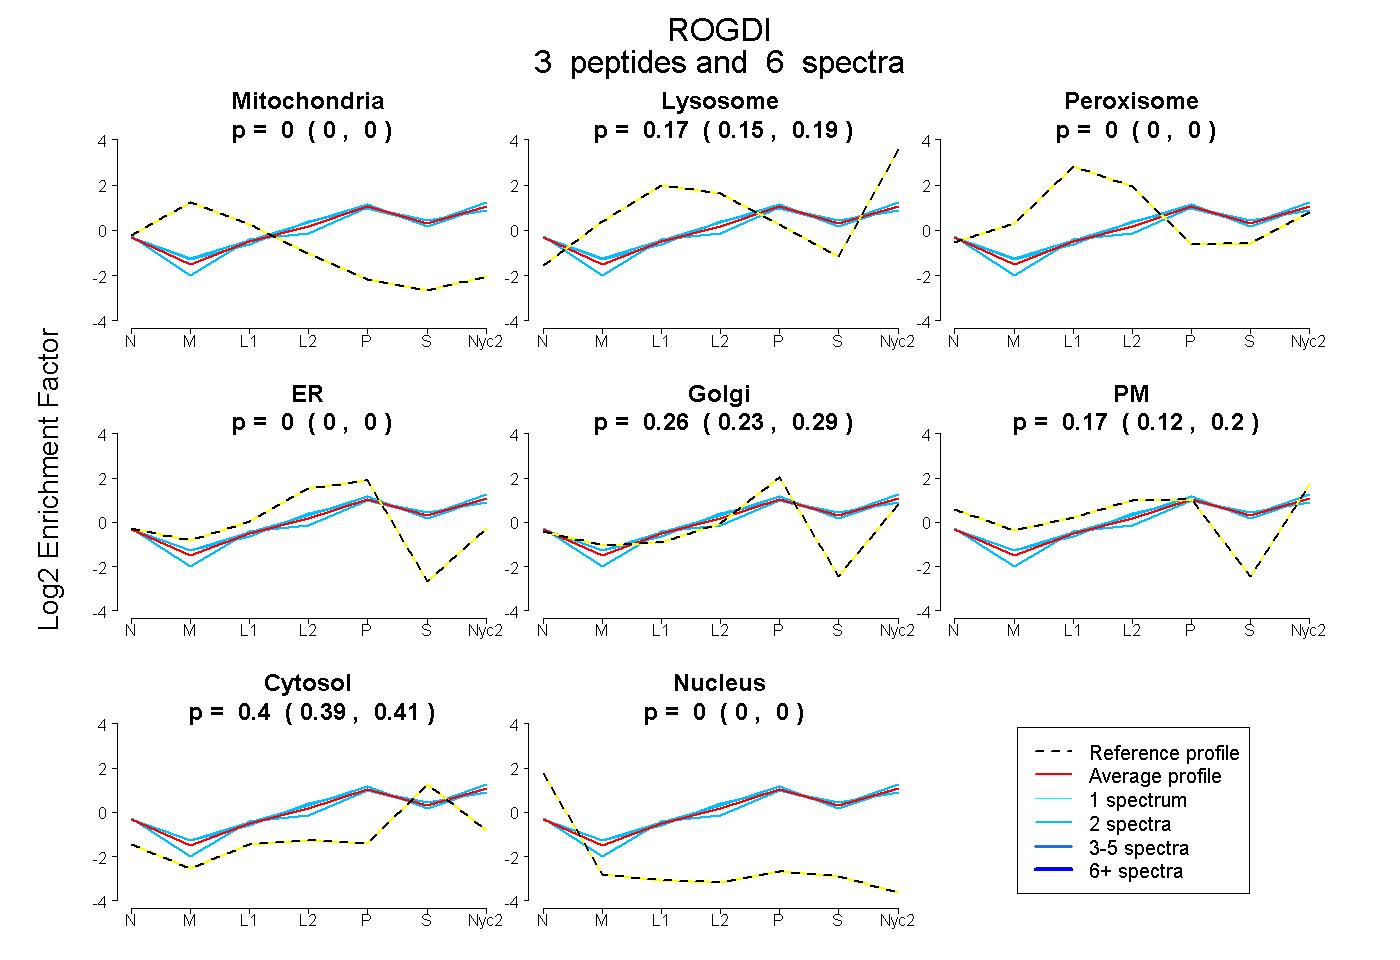
0.000 | 0.000
0.151 | 0.189
0.000 | 0.000
0.000 | 0.000
0.225 | 0.293
0.120 | 0.204
0.386 | 0.412
0.000 | 0.000
2peptides
spectra
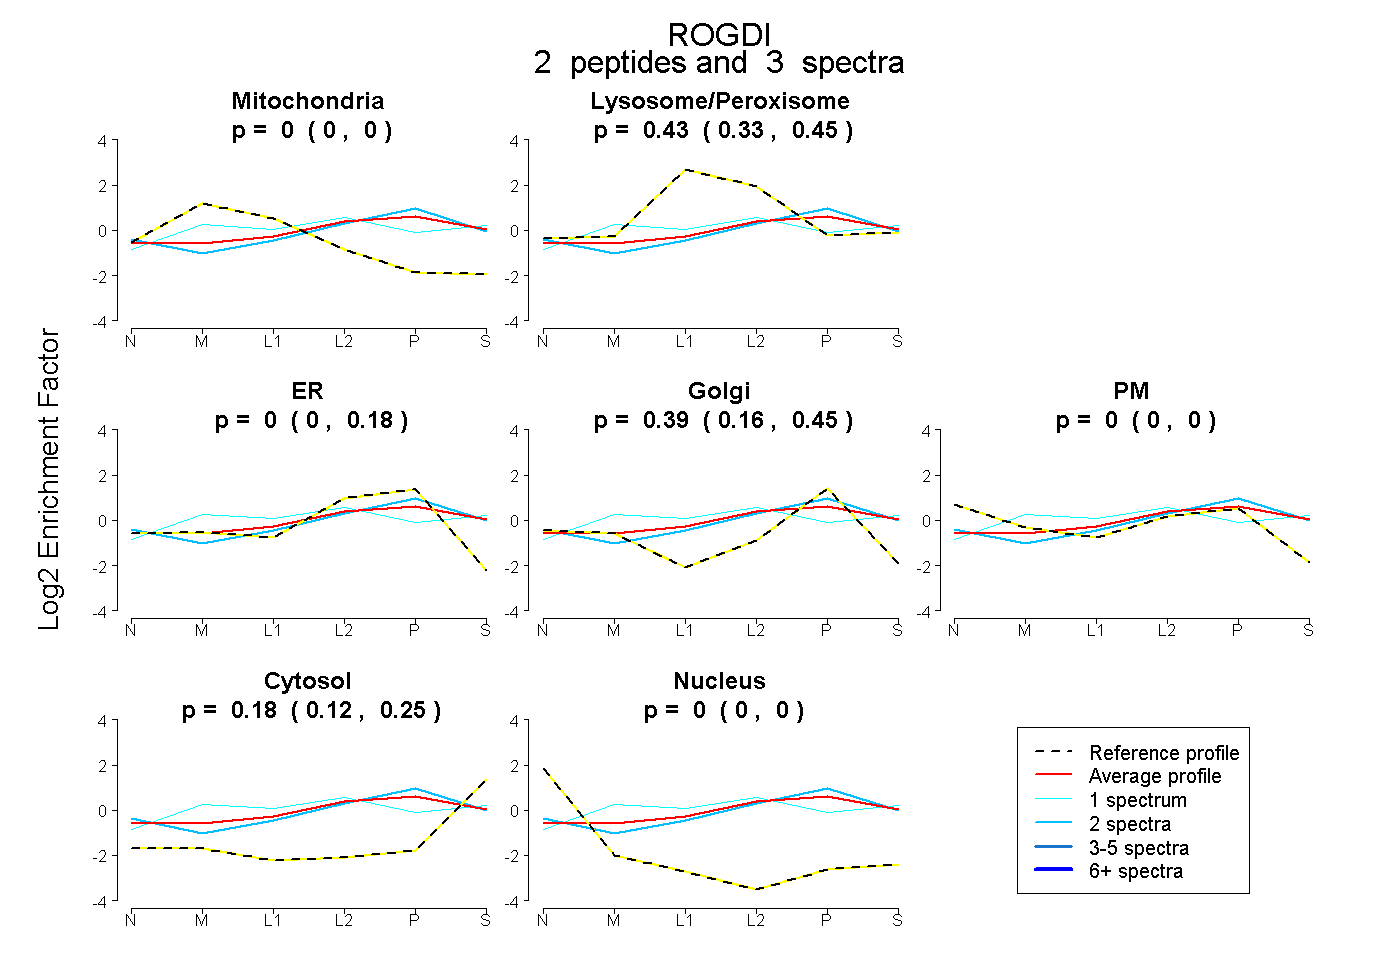
0.000 | 0.000
0.334 | 0.452
0.000 | 0.177
0.156 | 0.450
0.000 | 0.000
0.117 | 0.254
0.000 | 0.000
3peptides
spectra
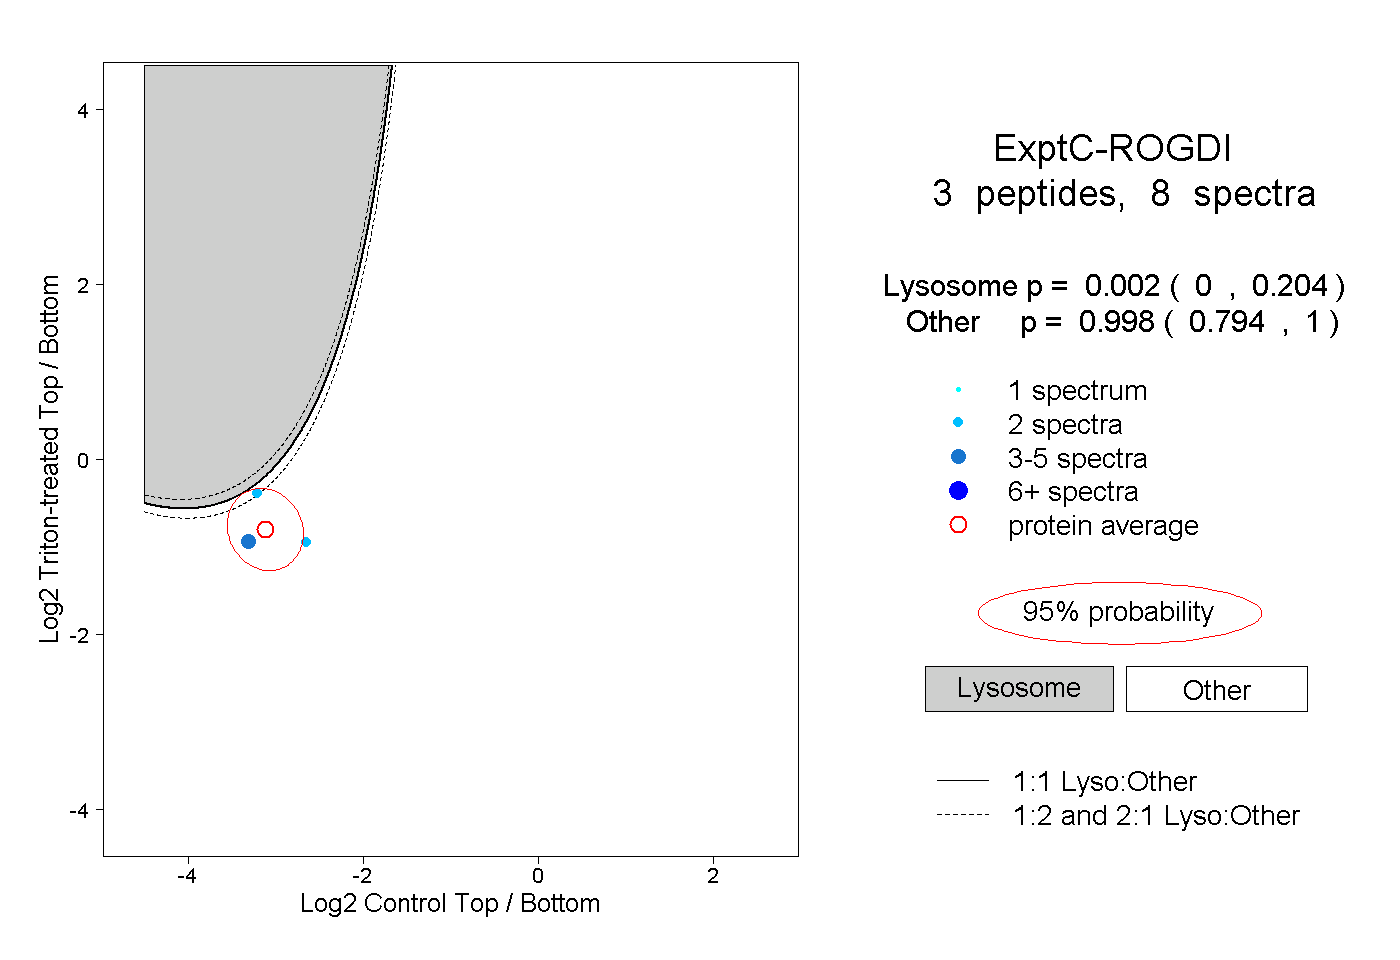
0.000 | 0.204
0.794 | 1.000