 3
3peptides
spectra
0.000 | 0.000
0.151 | 0.189
0.000 | 0.000
0.000 | 0.000
0.225 | 0.293
0.120 | 0.204
0.386 | 0.412
0.000 | 0.000
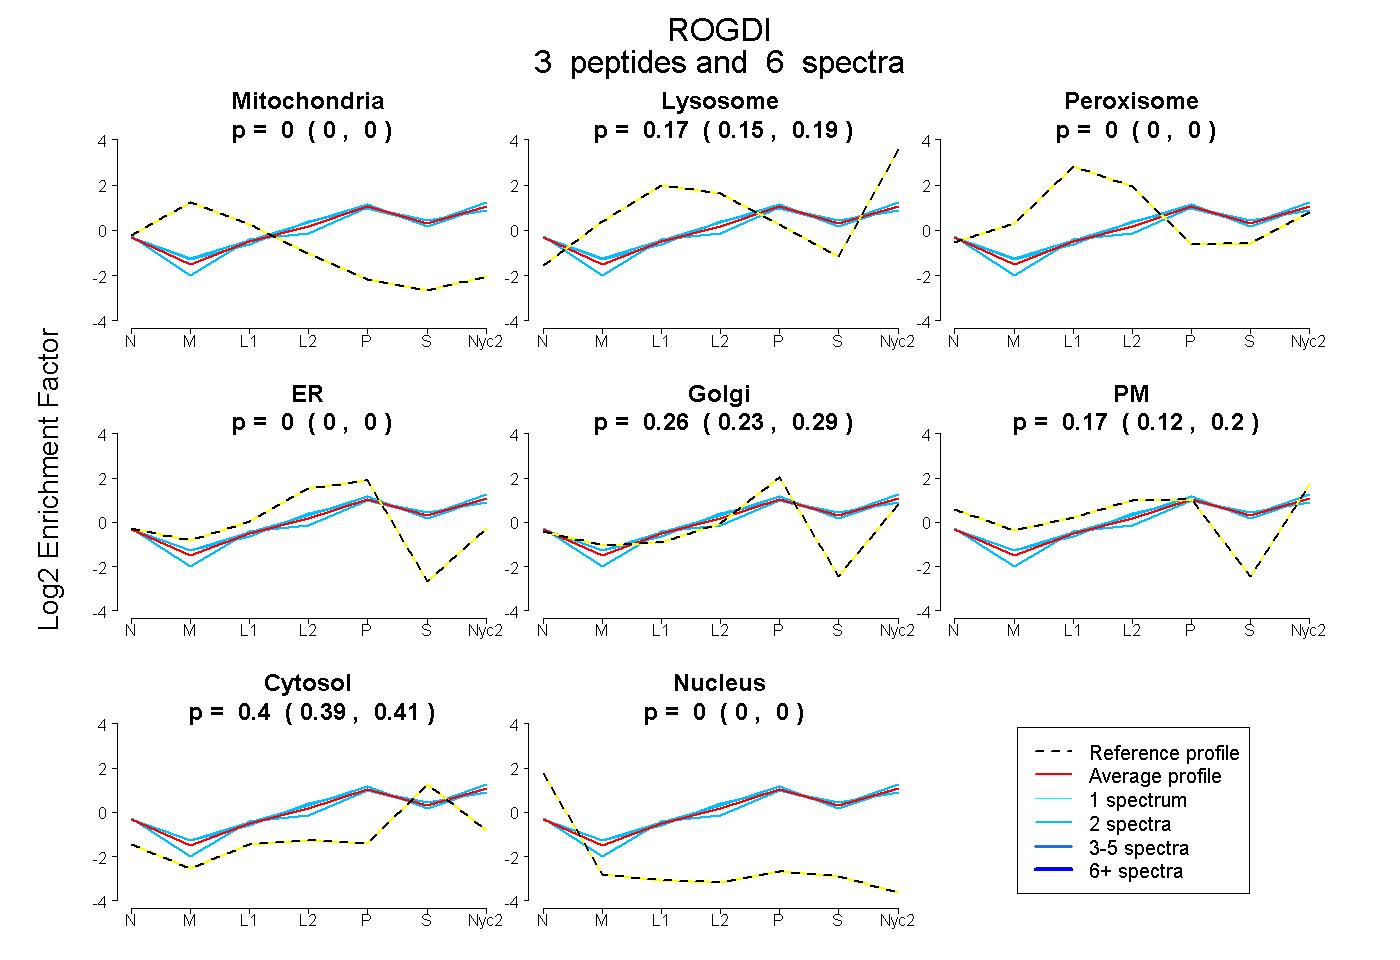
| Plot | Mito | Lyso | Perox | ER | Golgi | PM | Cytosol | Nucleus | |||||
| Expt A |
3 peptides |
6 spectra |
|
0.000 0.000 | 0.000 |
0.173 0.151 | 0.189 |
0.000 0.000 | 0.000 |
0.000 0.000 | 0.000 |
0.262 0.225 | 0.293 |
0.166 0.120 | 0.204 |
0.399 0.386 | 0.412 |
0.000 0.000 | 0.000 |
| 2 spectra, LMDAVMLQLTR | 0.000 | 0.193 | 0.000 | 0.000 | 0.289 | 0.161 | 0.357 | 0.000 | ||
| 2 spectra, AVLEEEFR | 0.000 | 0.131 | 0.000 | 0.000 | 0.271 | 0.137 | 0.461 | 0.000 | ||
| 2 spectra, NNQLLHFAFR | 0.000 | 0.195 | 0.000 | 0.000 | 0.225 | 0.199 | 0.380 | 0.000 |
| Plot | Mito | Lyso or Perox | ER | Golgi | PM | Cytosol | Nucleus | ||||||
| Expt B |
2 peptides |
3 spectra |
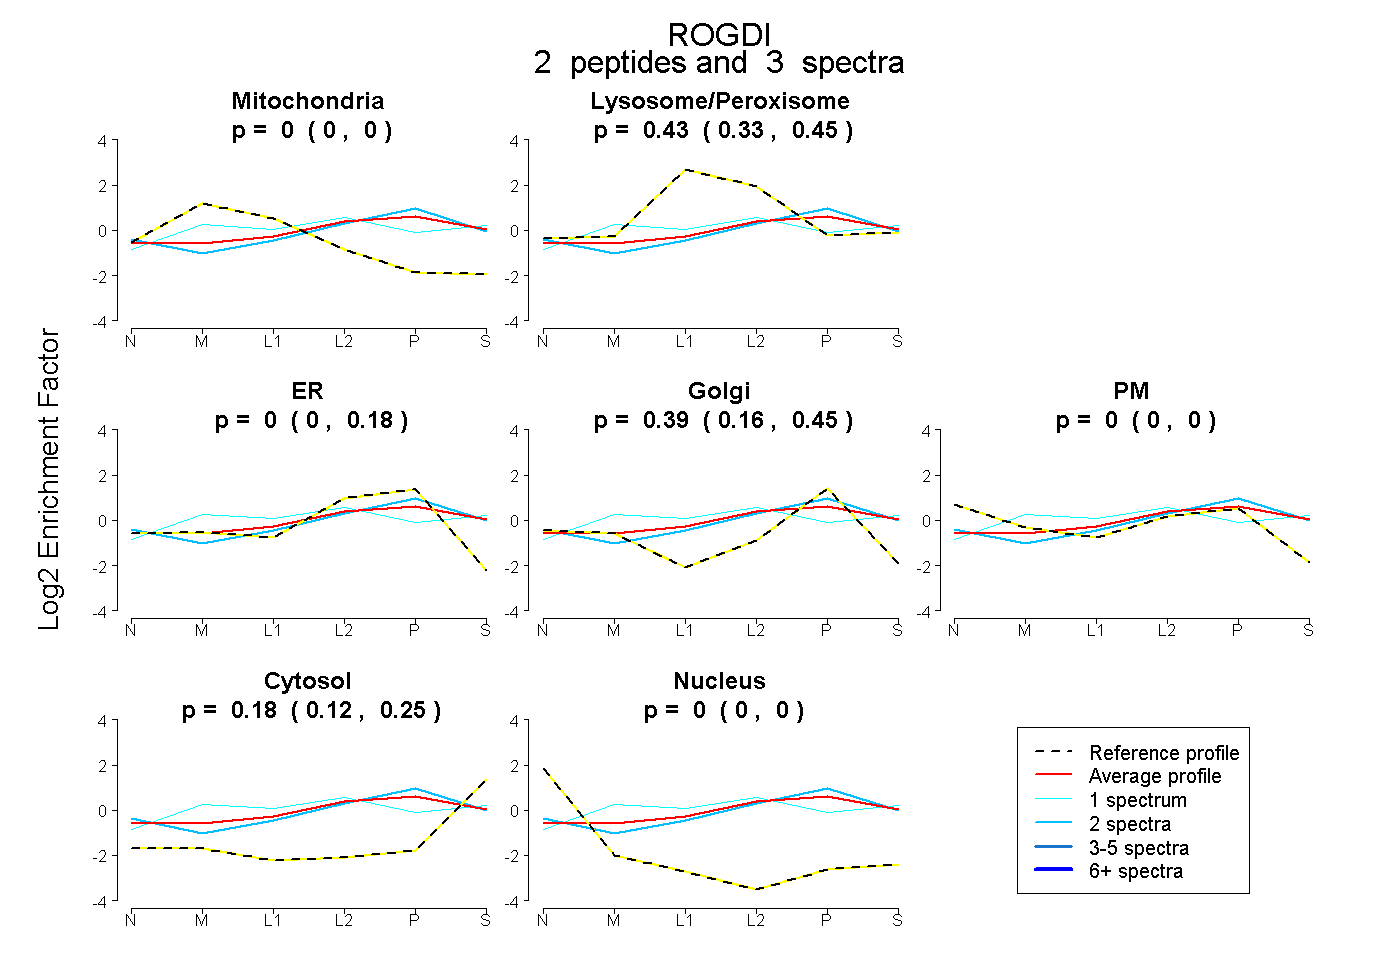 |
0.000 0.000 | 0.000 |
0.429 0.334 | 0.452 |
0.000 0.000 | 0.177 |
0.393 0.156 | 0.450 |
0.000 0.000 | 0.000 |
0.178 0.117 | 0.254 |
0.000 0.000 | 0.000 |
|||
| Plot | Lyso | Other | |||||||||||
| Expt C |
3 peptides |
8 spectra |
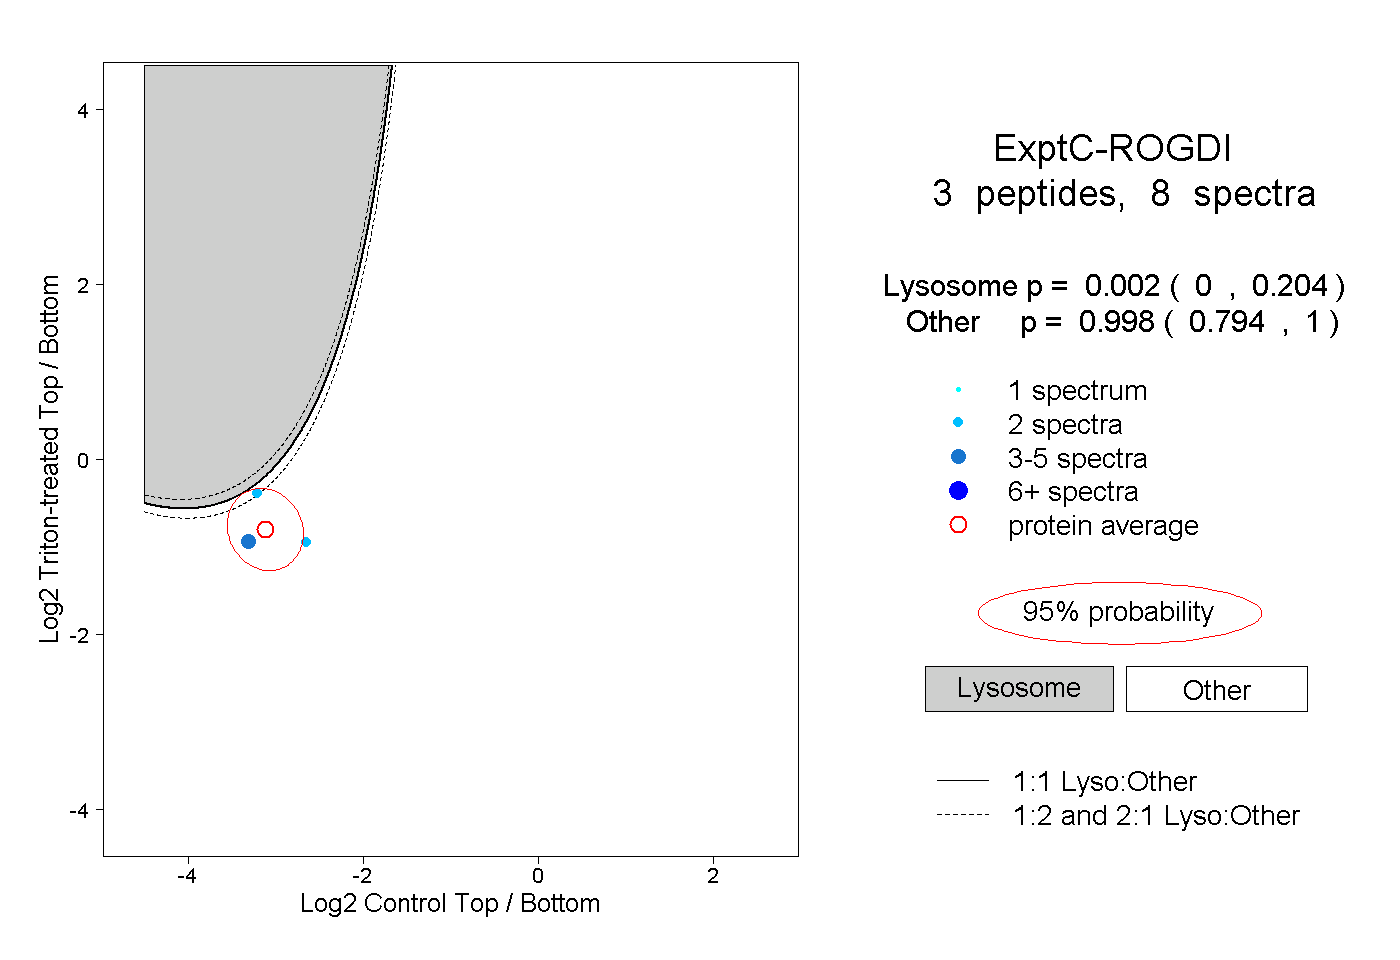 |
0.002 0.000 | 0.204 |
0.998 0.794 | 1.000 |