 5
5peptides
spectra
0.682 | 0.708
0.000 | 0.000
0.000 | 0.000
0.052 | 0.177
0.066 | 0.216
0.000 | 0.000
0.000 | 0.043
0.000 | 0.034
6peptides
spectra
0.000 | 0.000
1.000 | 1.000
| Plot | Mito | Lyso | Perox | ER | Golgi | PM | Cytosol | Nucleus | |||||
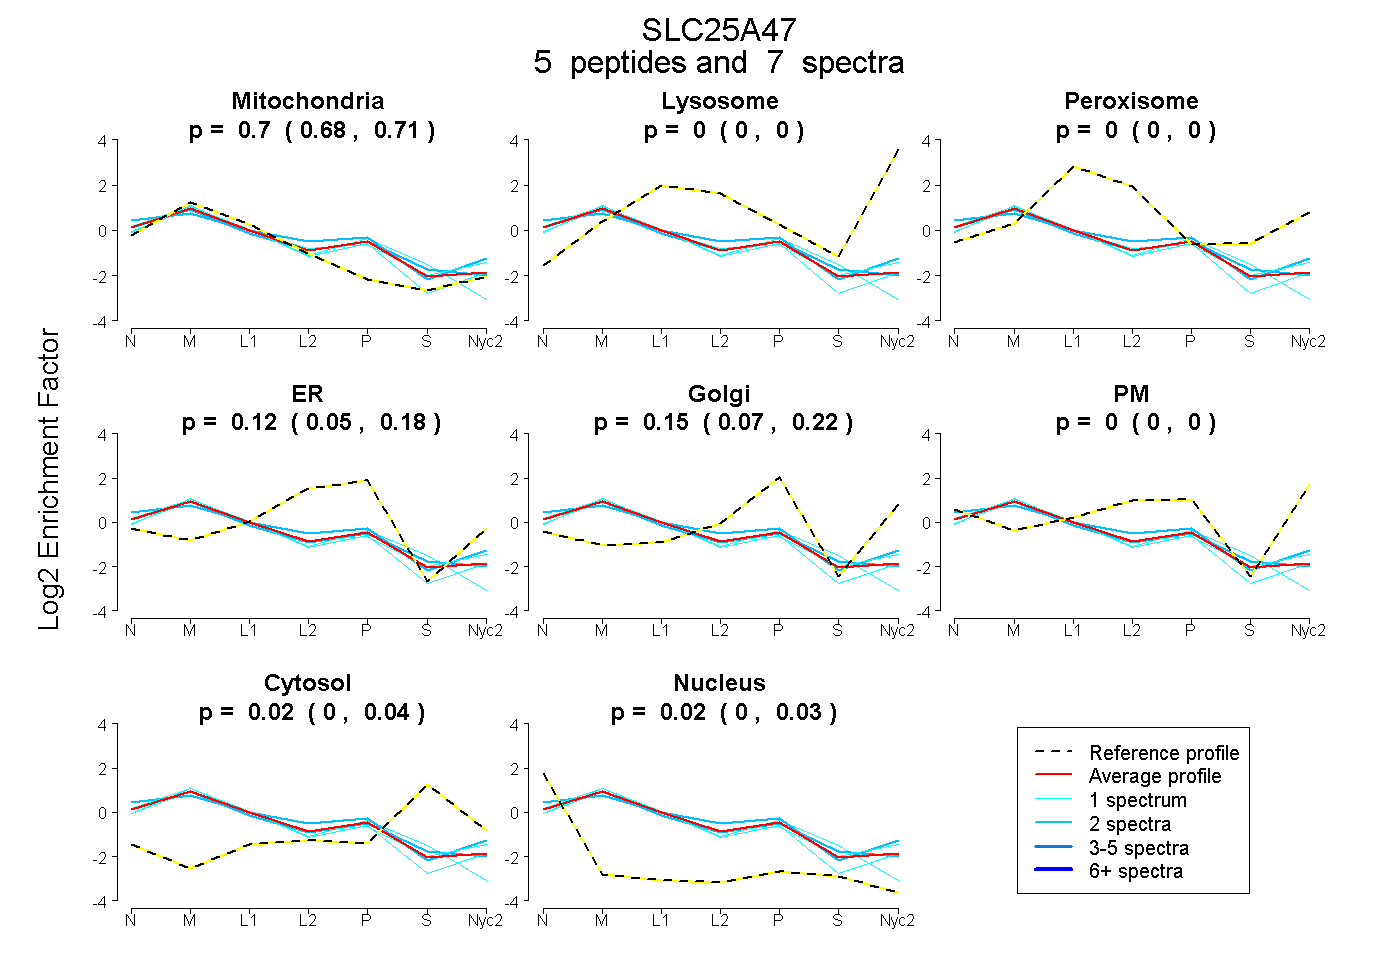
| Expt A |
5 peptides |
7 spectra |
|
0.697 0.682 | 0.708 |
0.000 0.000 | 0.000 |
0.000 0.000 | 0.000 |
0.118 0.052 | 0.177 |
0.152 0.066 | 0.216 |
0.000 0.000 | 0.000 |
0.018 0.000 | 0.043 |
0.016 0.000 | 0.034 |
||
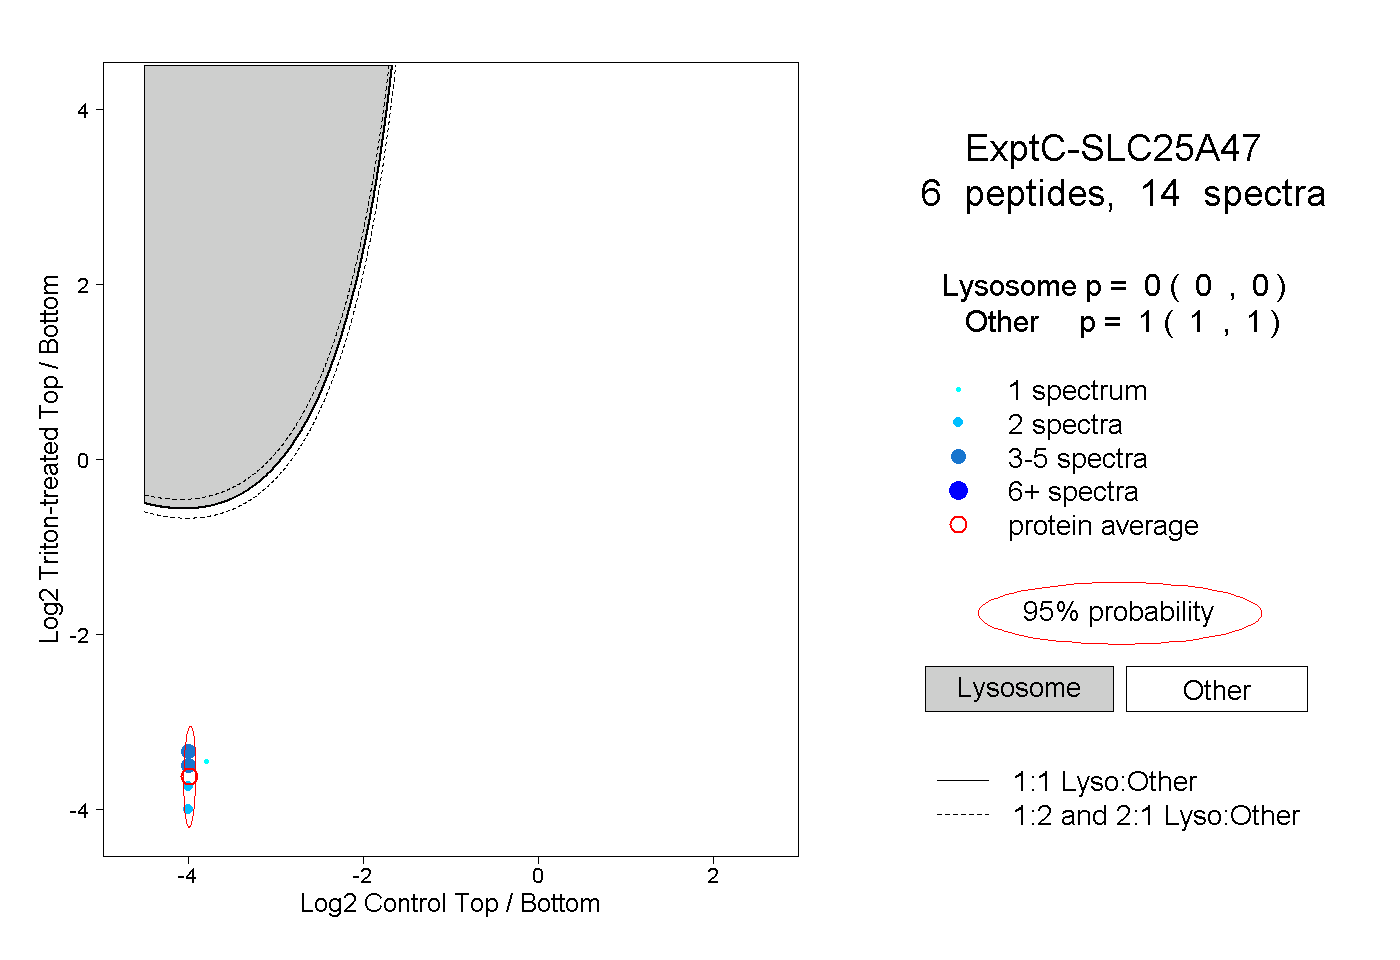
| Plot | Lyso | Other | |||||||||||
| Expt C |
6 peptides |
14 spectra |
|
0.000 0.000 | 0.000 |
1.000 1.000 | 1.000 |