 5
5peptides
spectra
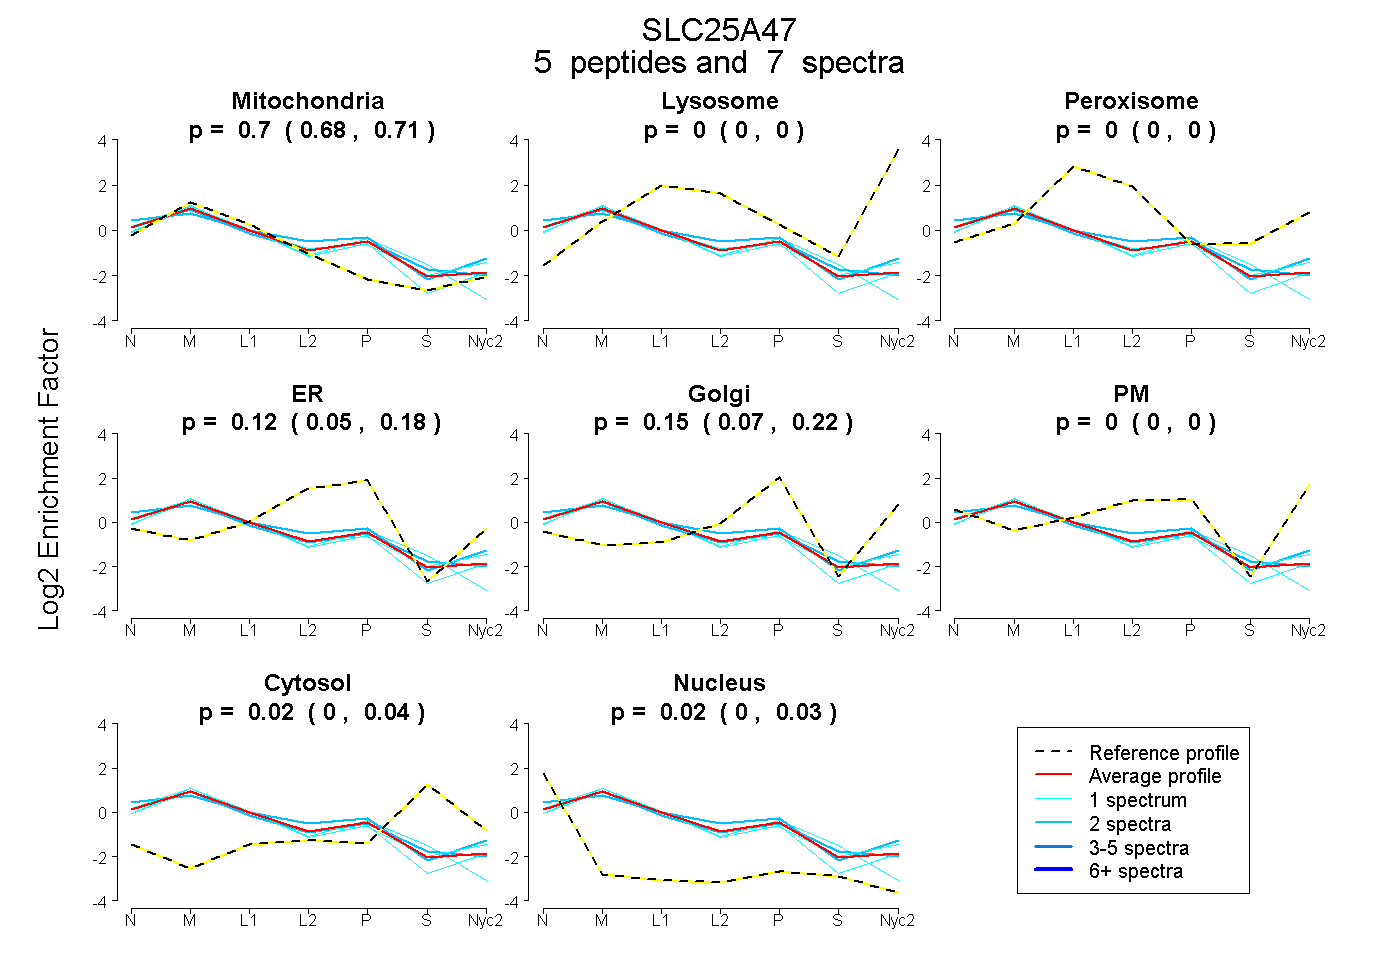
0.682 | 0.708
0.000 | 0.000
0.000 | 0.000
0.052 | 0.177
0.066 | 0.216
0.000 | 0.000
0.000 | 0.043
0.000 | 0.034
| Plot | Mito | Lyso | Perox | ER | Golgi | PM | Cytosol | Nucleus | |||||
| Expt A |
5 peptides |
7 spectra |
|
0.697 0.682 | 0.708 |
0.000 0.000 | 0.000 |
0.000 0.000 | 0.000 |
0.118 0.052 | 0.177 |
0.152 0.066 | 0.216 |
0.000 0.000 | 0.000 |
0.018 0.000 | 0.043 |
0.016 0.000 | 0.034 |
| 2 spectra, GLLHCVVTSVR | 0.586 | 0.000 | 0.000 | 0.148 | 0.115 | 0.126 | 0.000 | 0.025 | ||
| 1 spectrum, GLALNCCR | 0.705 | 0.000 | 0.000 | 0.163 | 0.000 | 0.000 | 0.086 | 0.046 | ||
| 1 spectrum, LWGFYR | 0.701 | 0.000 | 0.027 | 0.000 | 0.257 | 0.000 | 0.014 | 0.000 | ||
| 1 spectrum, LQTQAQSQTQQR | 0.743 | 0.000 | 0.000 | 0.050 | 0.182 | 0.000 | 0.000 | 0.025 | ||
| 2 spectra, LQADGQGQQR | 0.680 | 0.000 | 0.000 | 0.140 | 0.093 | 0.000 | 0.071 | 0.015 |
| Plot | Lyso | Other | |||||||||||
| Expt C |
6 peptides |
14 spectra |
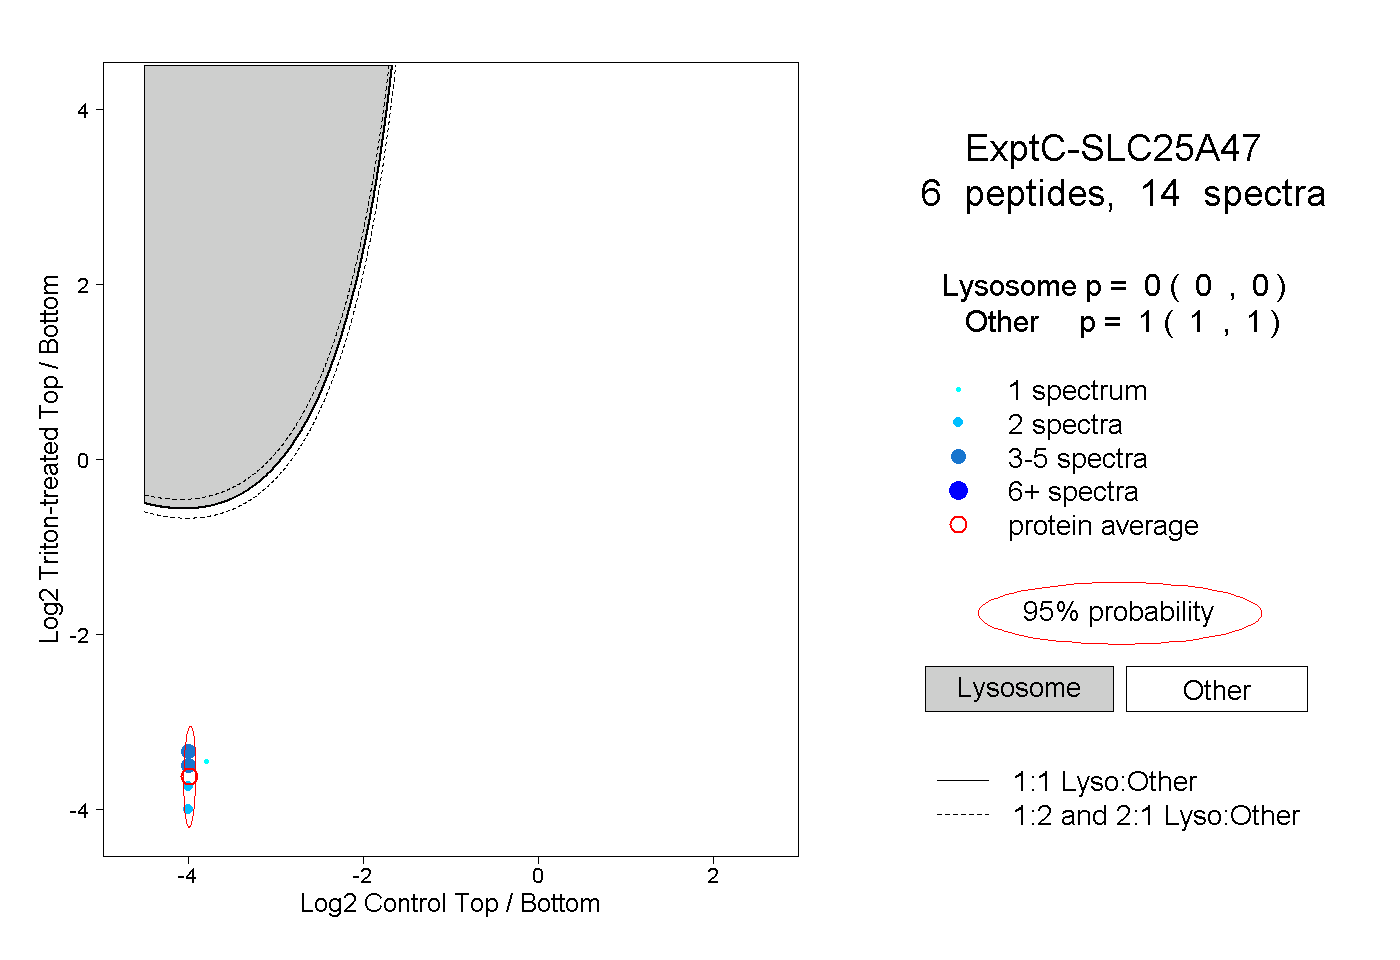 |
0.000 0.000 | 0.000 |
1.000 1.000 | 1.000 |