 12
12peptides
spectra
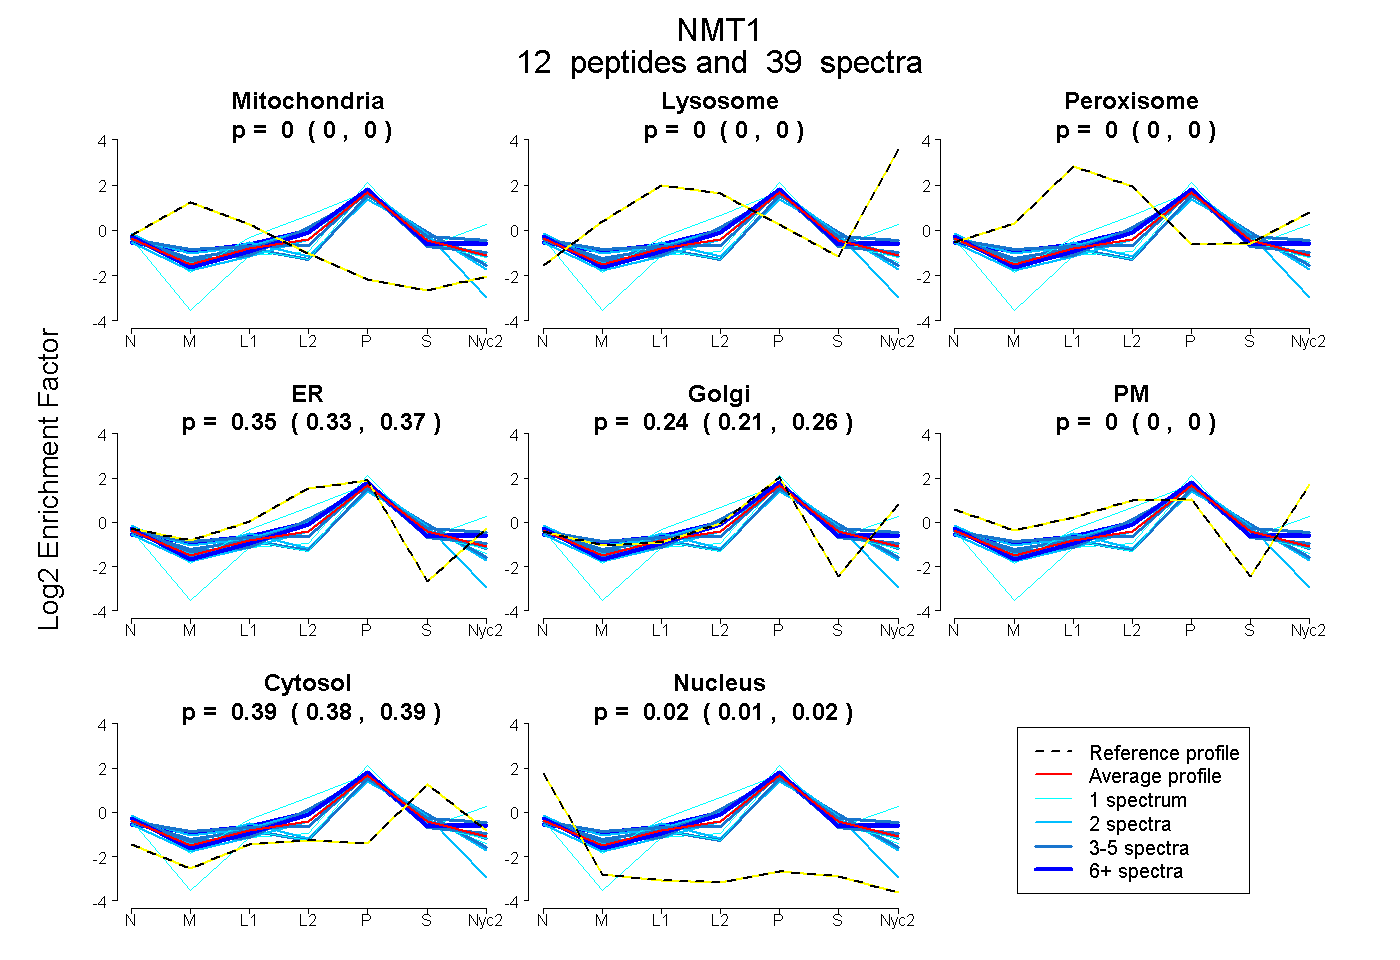
0.000 | 0.000
0.000 | 0.000
0.000 | 0.000
0.329 | 0.375
0.212 | 0.264
0.000 | 0.000
0.383 | 0.391
0.013 | 0.025
5peptides
spectra
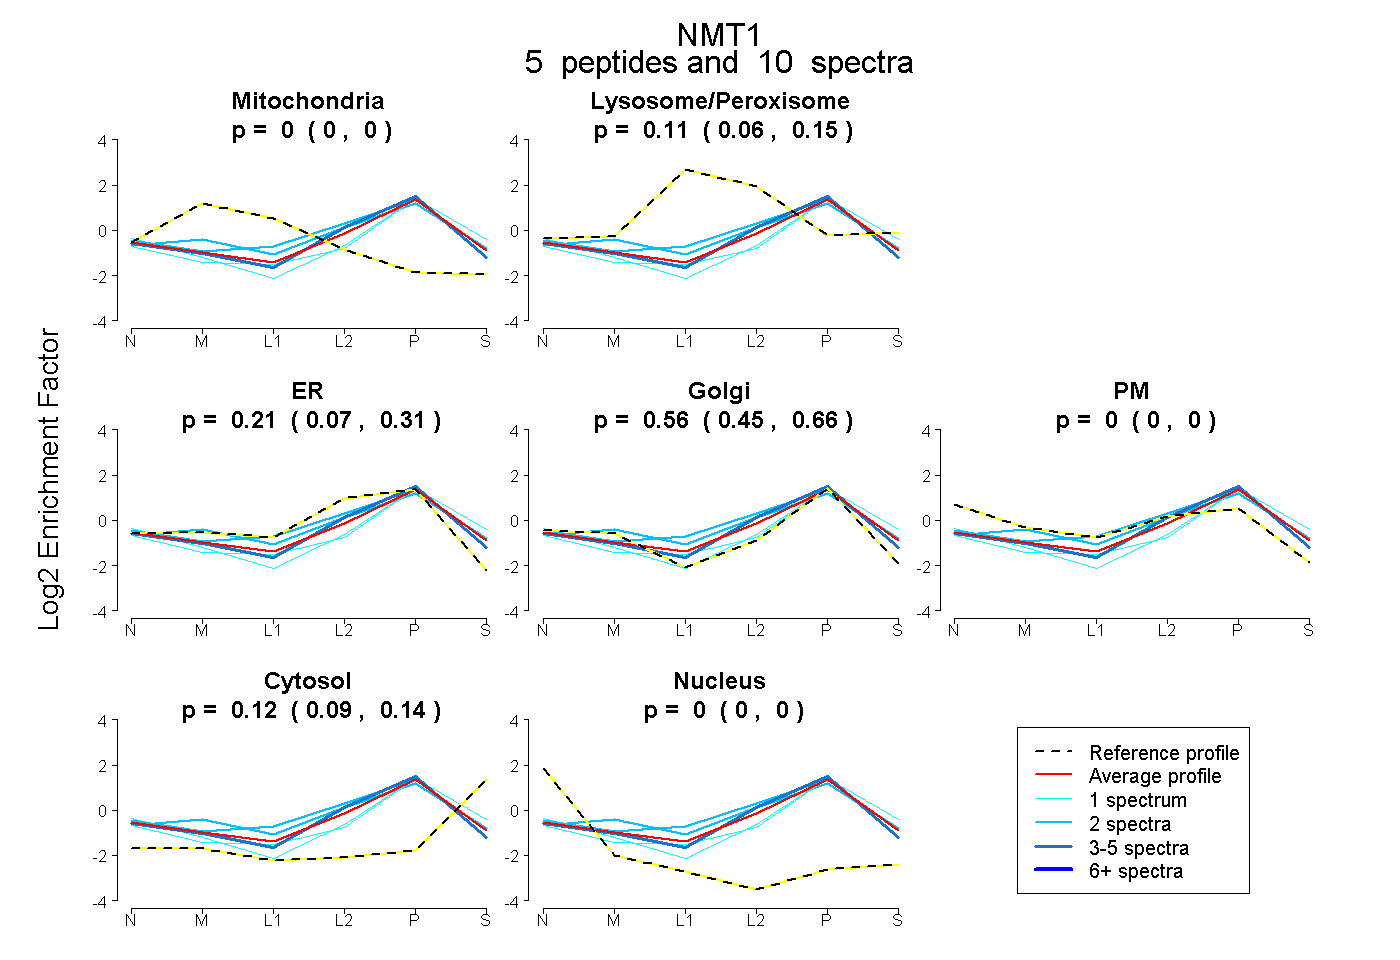
0.000 | 0.000
0.058 | 0.154
0.071 | 0.313
0.447 | 0.658
0.000 | 0.000
0.093 | 0.144
0.000 | 0.000
9peptides
spectra
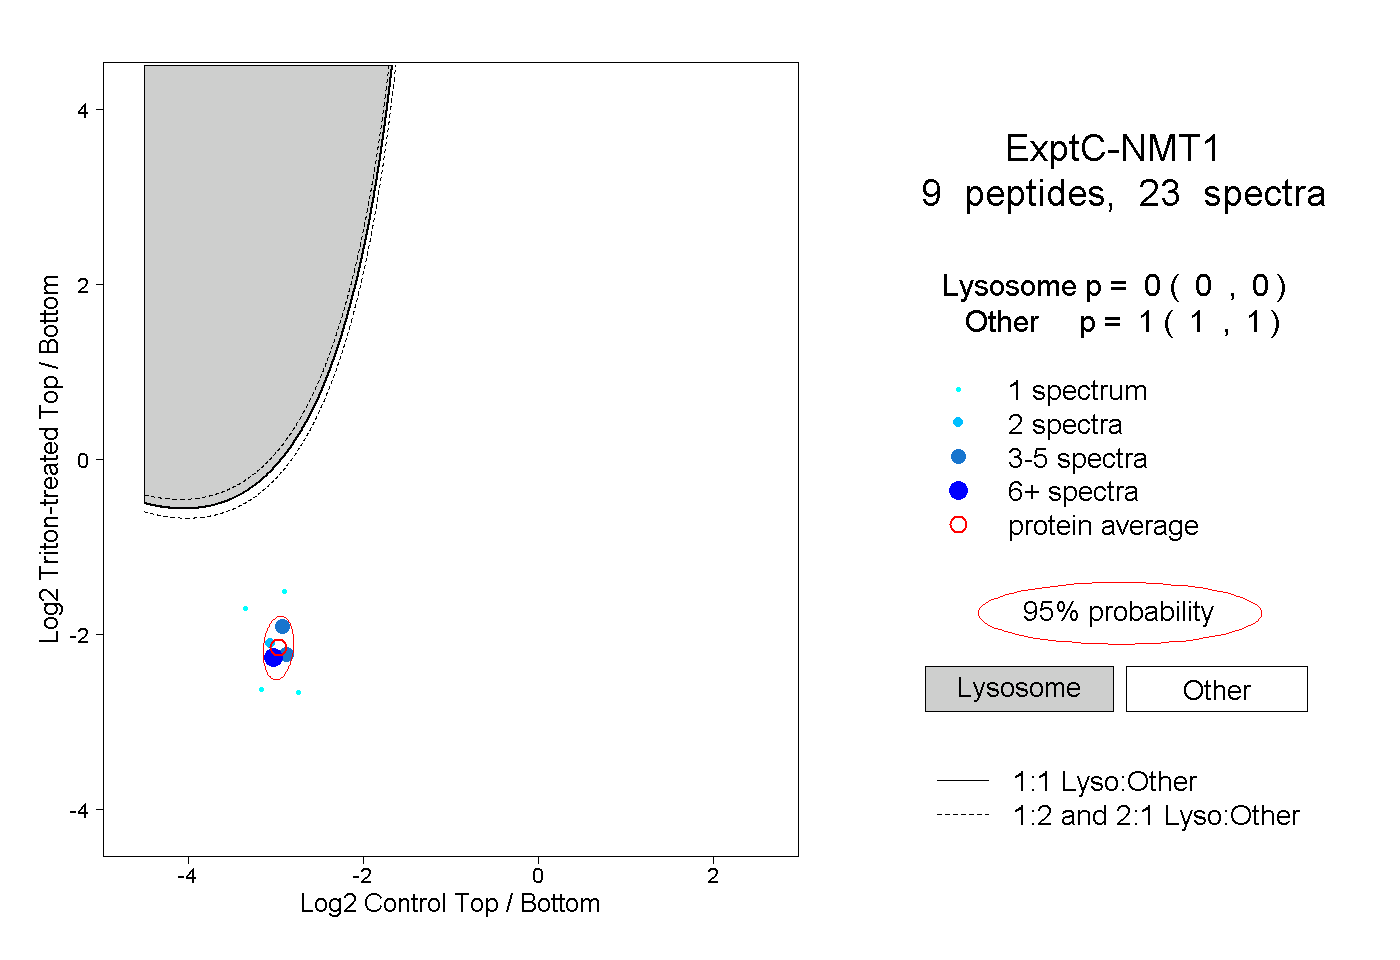
0.000 | 0.000
1.000 | 1.000
3peptides
spectra
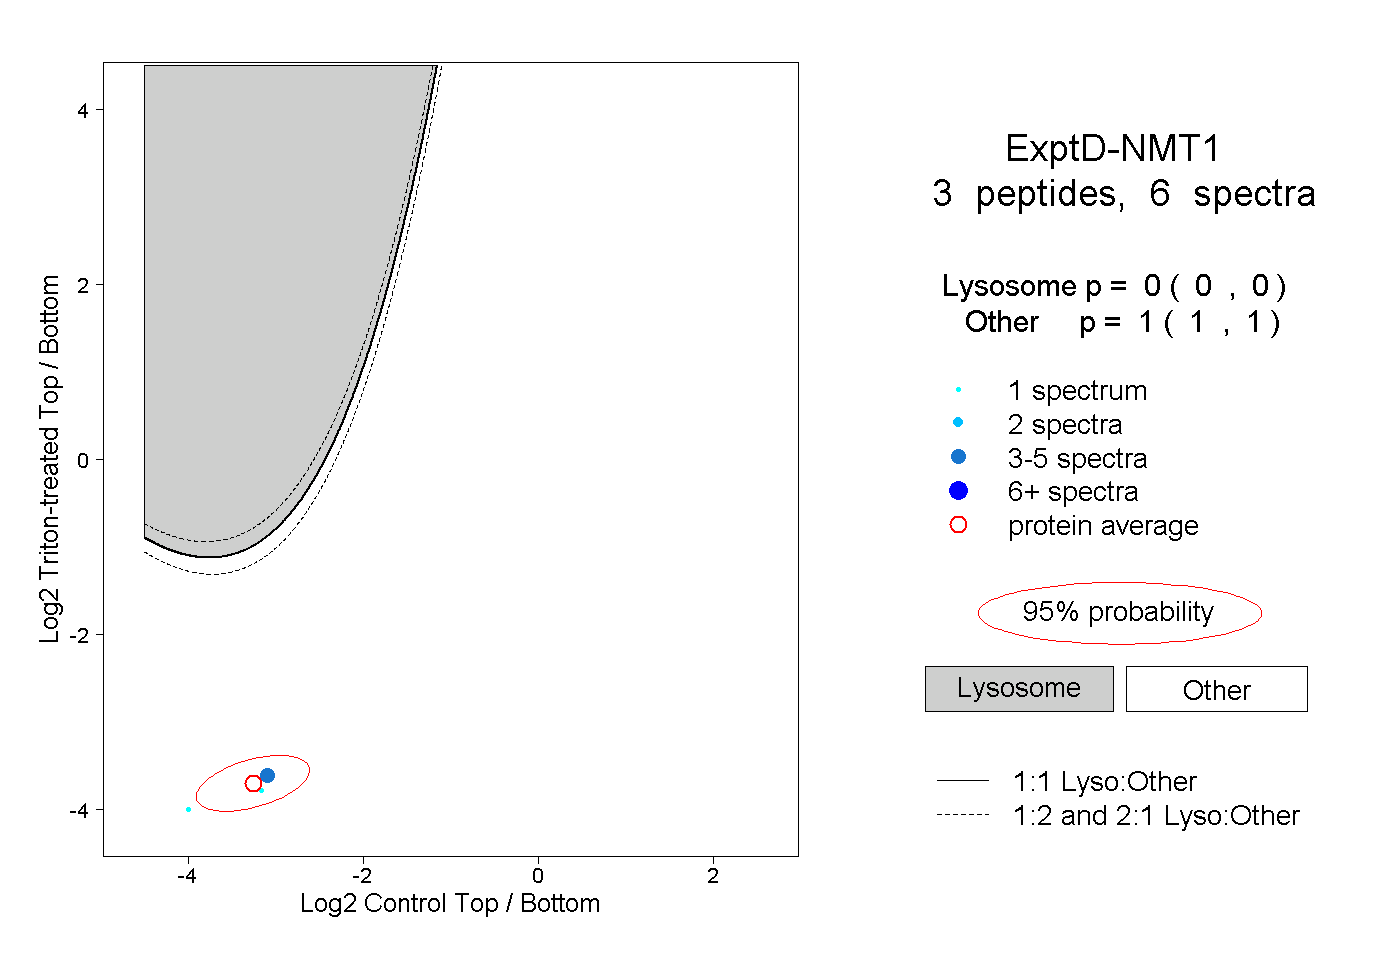
0.000 | 0.000
1.000 | 1.000