 12
12peptides
spectra
0.000 | 0.000
0.000 | 0.000
0.000 | 0.000
0.329 | 0.375
0.212 | 0.264
0.000 | 0.000
0.383 | 0.391
0.013 | 0.025
| Plot | Mito | Lyso | Perox | ER | Golgi | PM | Cytosol | Nucleus | |||||
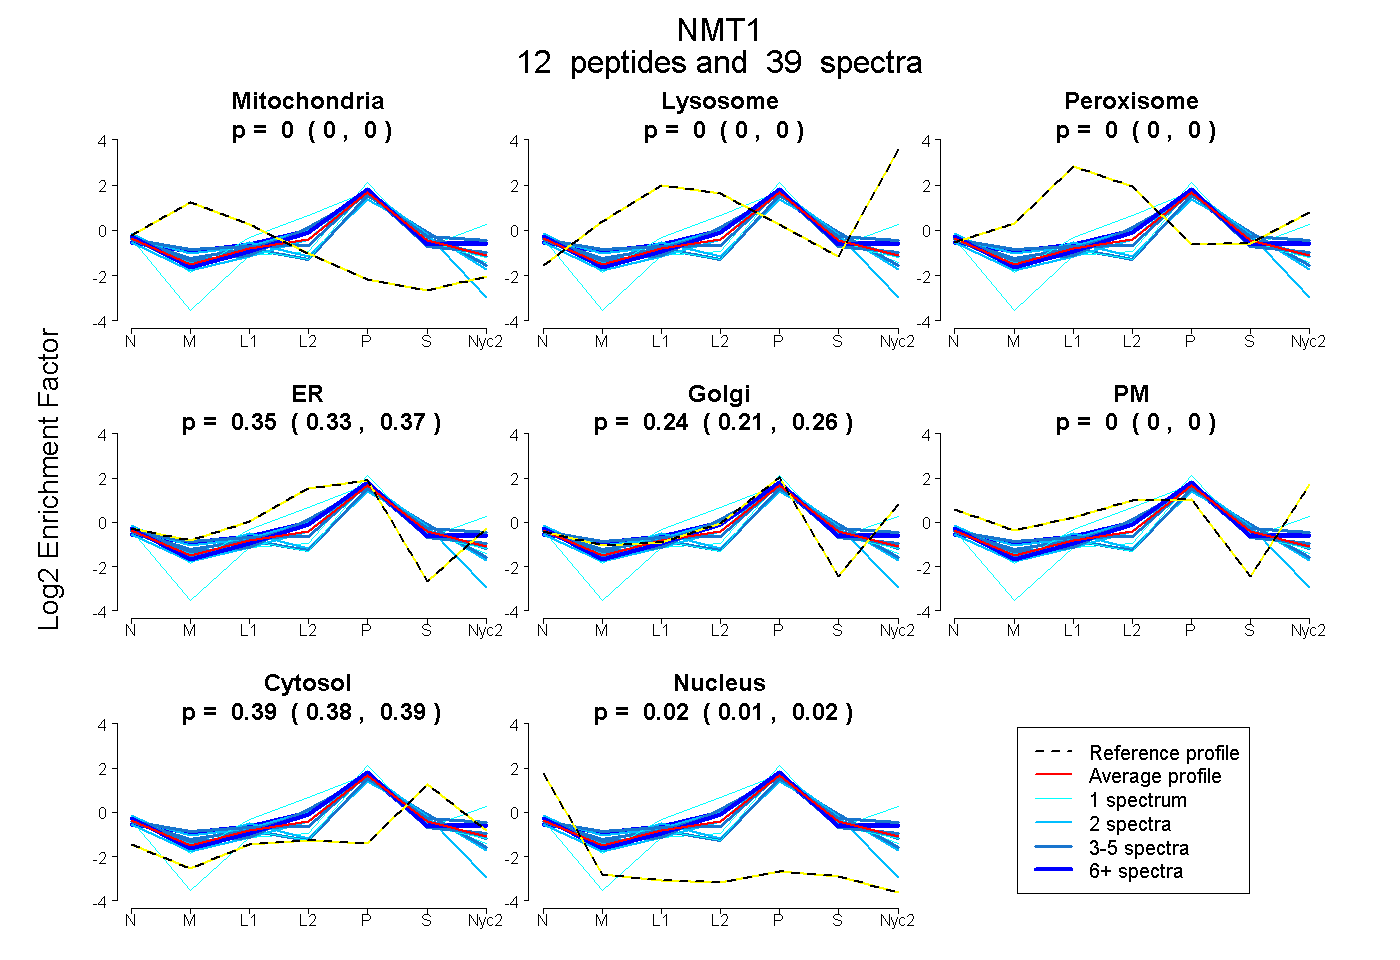
| Expt A |
12 peptides |
39 spectra |
|
0.000 0.000 | 0.000 |
0.000 0.000 | 0.000 |
0.000 0.000 | 0.000 |
0.354 0.329 | 0.375 |
0.240 0.212 | 0.264 |
0.000 0.000 | 0.000 |
0.387 0.383 | 0.391 |
0.019 0.013 | 0.025 |
| 6 spectra, VAPVLIR | 0.000 | 0.000 | 0.000 | 0.294 | 0.374 | 0.000 | 0.332 | 0.000 | ||
| 3 spectra, TAGLRPMEK | 0.000 | 0.000 | 0.000 | 0.313 | 0.312 | 0.000 | 0.376 | 0.000 | ||
| 2 spectra, DIPVVHQLLSR | 0.000 | 0.000 | 0.000 | 0.516 | 0.134 | 0.000 | 0.350 | 0.000 | ||
| 1 spectrum, AIELFSVGQGPAK | 0.000 | 0.000 | 0.000 | 0.000 | 0.640 | 0.000 | 0.360 | 0.000 | ||
| 4 spectra, TMEEASK | 0.043 | 0.000 | 0.000 | 0.242 | 0.399 | 0.000 | 0.309 | 0.008 | ||
| 4 spectra, GFDVFNALDLMENK | 0.000 | 0.000 | 0.000 | 0.486 | 0.114 | 0.000 | 0.399 | 0.001 | ||
| 8 spectra, CPSMGAEK | 0.000 | 0.000 | 0.000 | 0.420 | 0.256 | 0.000 | 0.324 | 0.000 | ||
| 2 spectra, MVEINFLCVHK | 0.000 | 0.000 | 0.000 | 0.467 | 0.000 | 0.000 | 0.399 | 0.133 | ||
| 1 spectrum, GNDMDSTQDQPVK | 0.000 | 0.000 | 0.000 | 0.639 | 0.000 | 0.000 | 0.361 | 0.000 | ||
| 1 spectrum, SYQFWDTQPVPK | 0.000 | 0.000 | 0.000 | 0.068 | 0.528 | 0.000 | 0.321 | 0.082 | ||
| 5 spectra, LQELQK | 0.000 | 0.000 | 0.000 | 0.193 | 0.288 | 0.000 | 0.443 | 0.076 | ||
| 2 spectra, FSHLSR | 0.000 | 0.000 | 0.000 | 0.340 | 0.132 | 0.000 | 0.440 | 0.089 |
| Plot | Mito | Lyso or Perox | ER | Golgi | PM | Cytosol | Nucleus | ||||||
| Expt B |
5 peptides |
10 spectra |
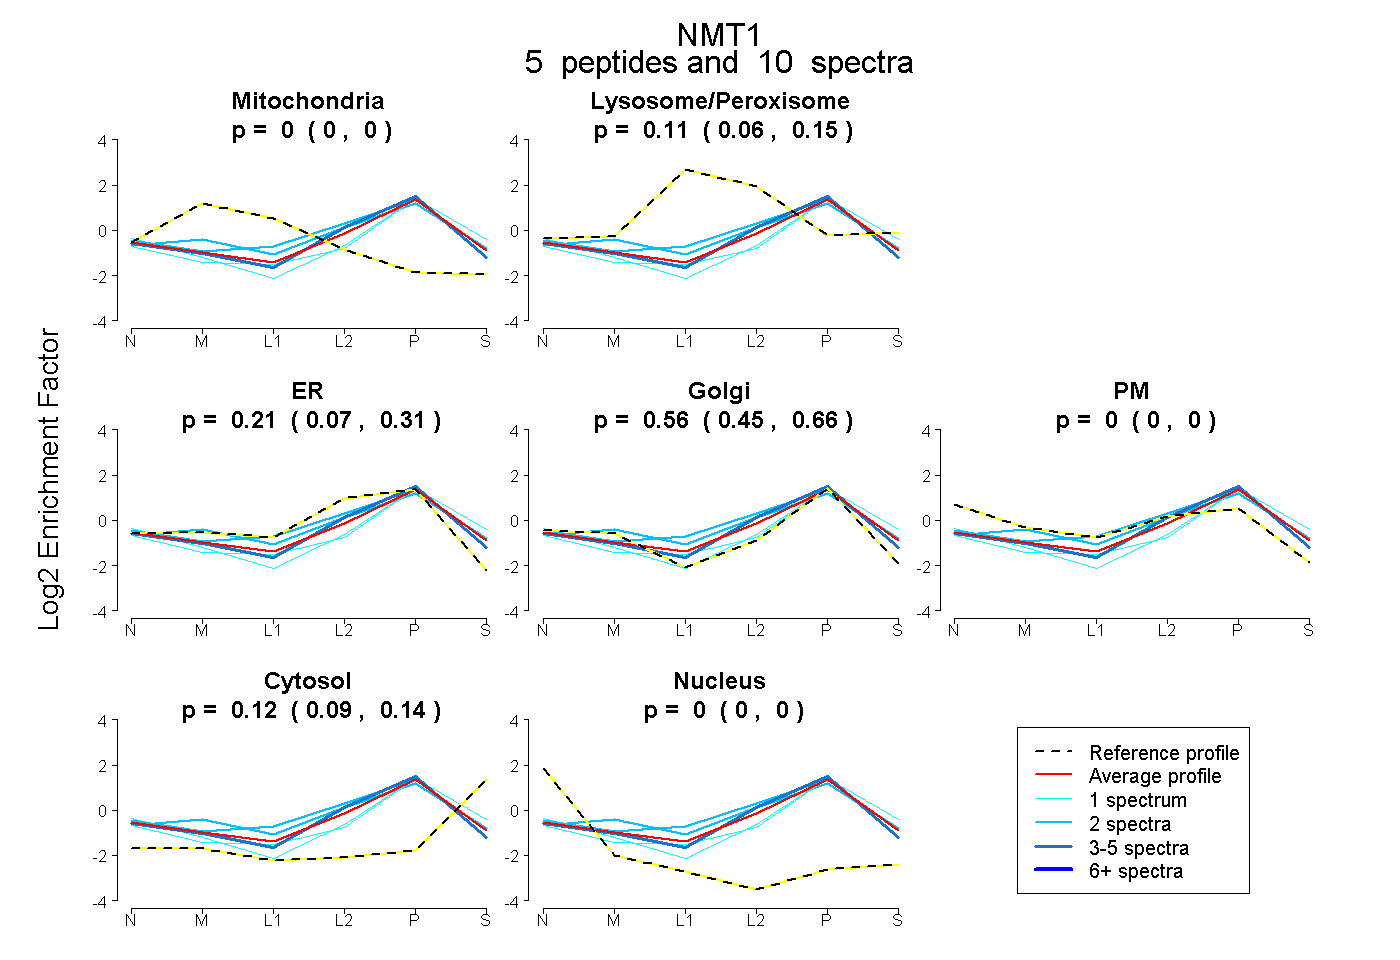 |
0.000 0.000 | 0.000 |
0.109 0.058 | 0.154 |
0.210 0.071 | 0.313 |
0.560 0.447 | 0.658 |
0.000 0.000 | 0.000 |
0.121 0.093 | 0.144 |
0.000 0.000 | 0.000 |
|||
| Plot | Lyso | Other | |||||||||||
| Expt C |
9 peptides |
23 spectra |
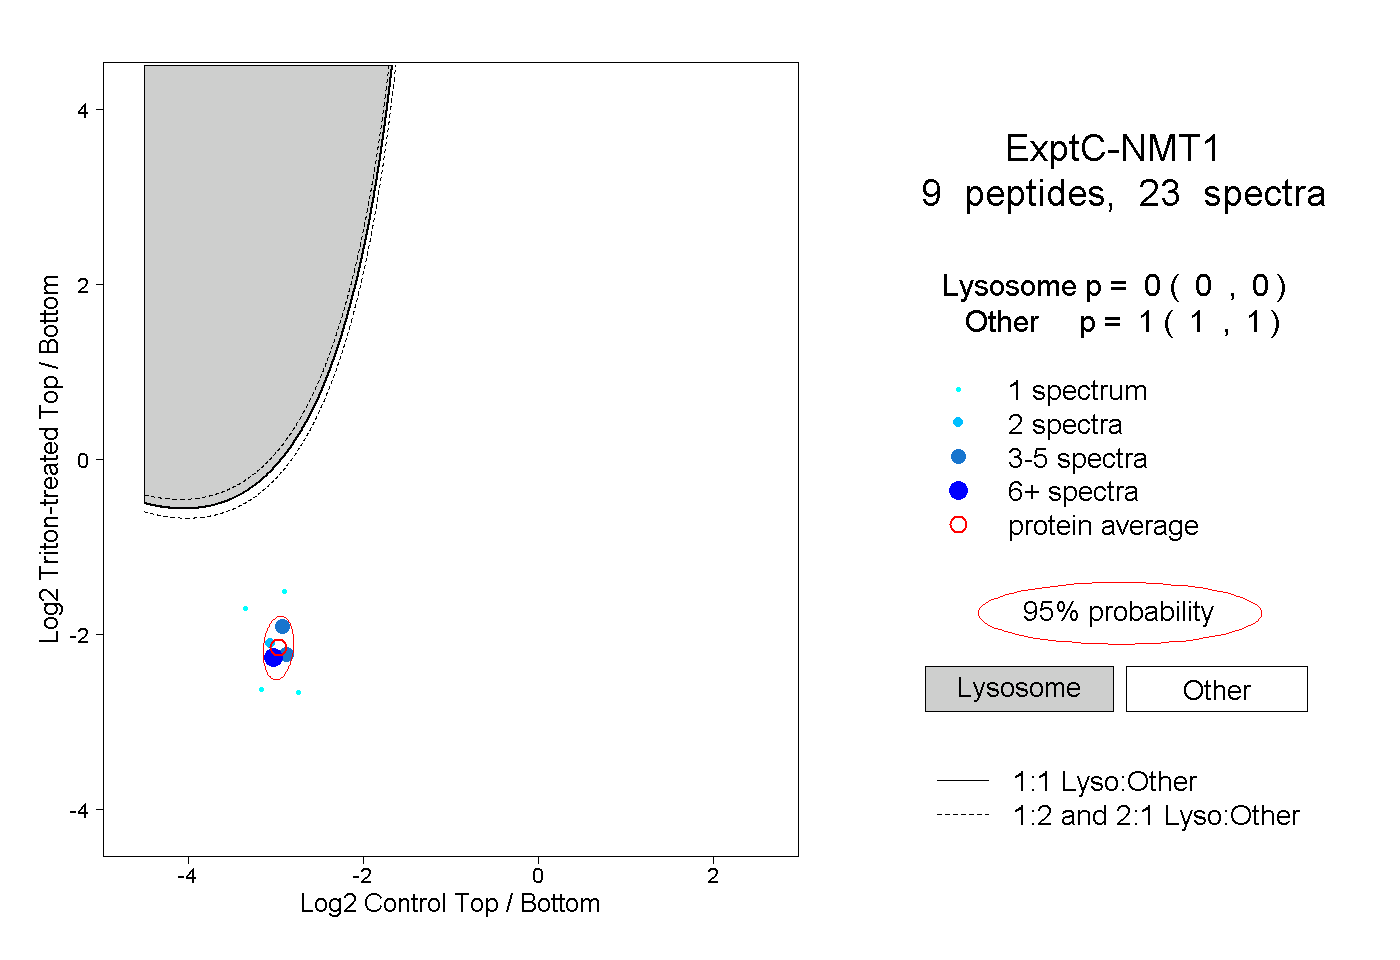 |
0.000 0.000 | 0.000 |
1.000 1.000 | 1.000 |
||||||||
| Plot | Lyso | Other | |||||||||||
| Expt D |
3 peptides |
6 spectra |
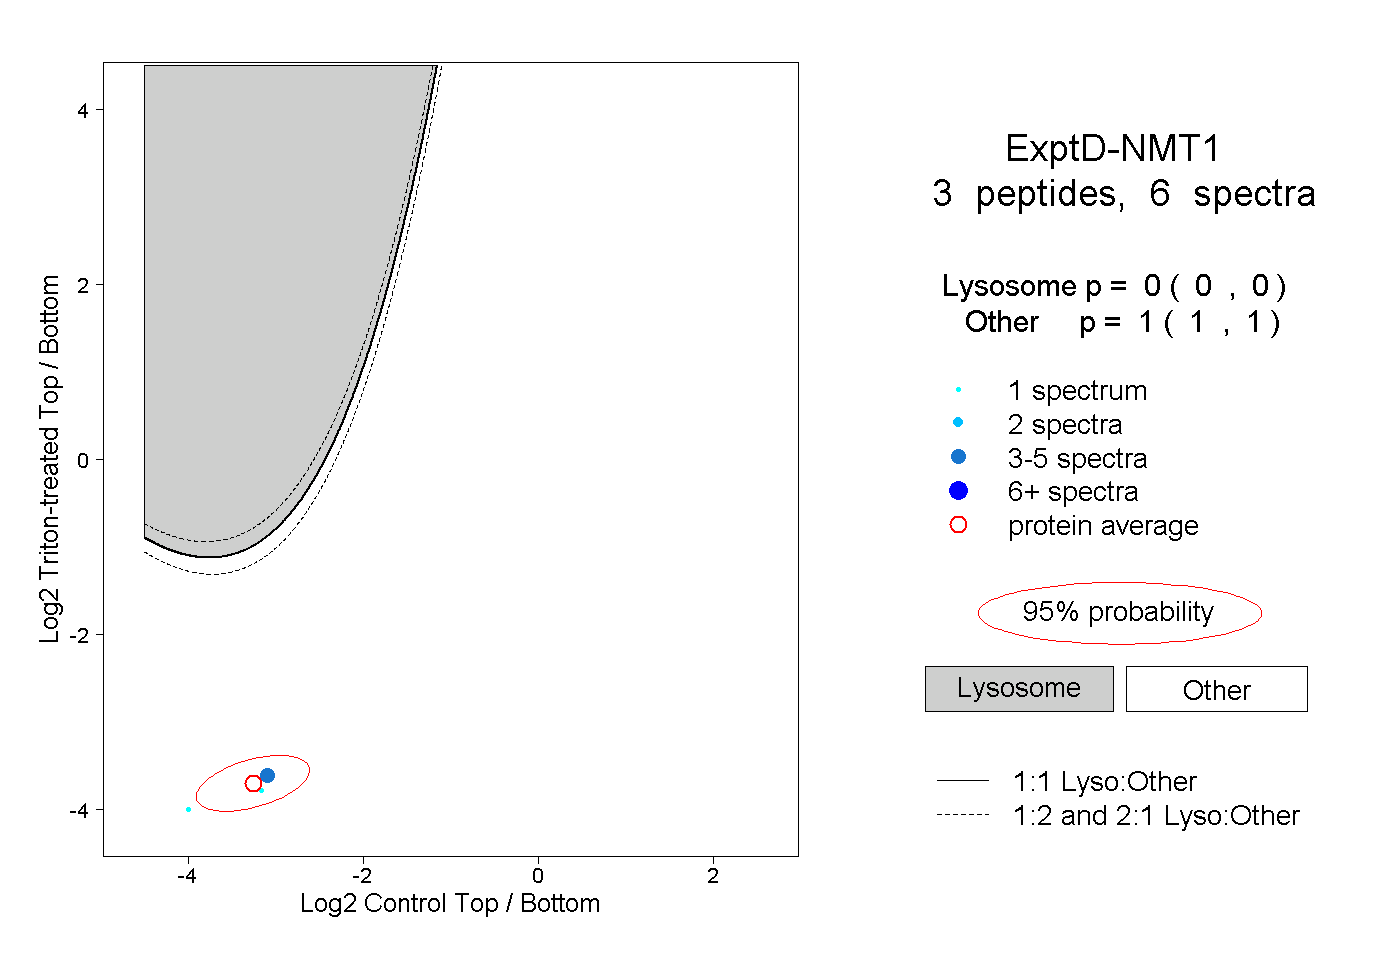 |
0.000 0.000 | 0.000 |
1.000 1.000 | 1.000 |