 3
3peptides
spectra
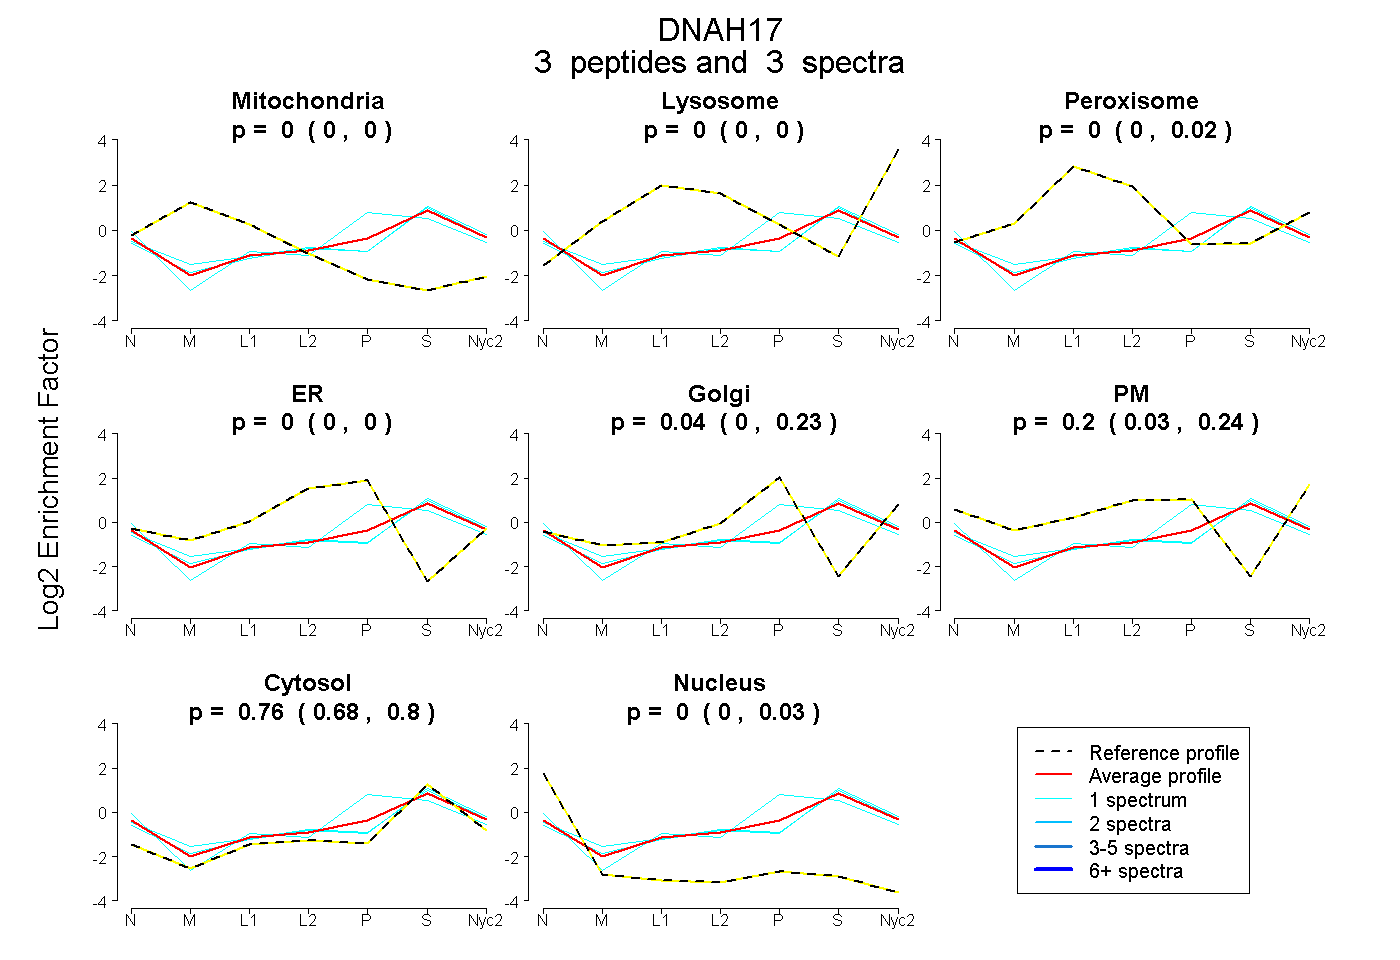
0.000 | 0.000
0.000 | 0.000
0.000 | 0.025
0.000 | 0.000
0.000 | 0.235
0.027 | 0.237
0.678 | 0.795
0.000 | 0.029
3peptides
spectra
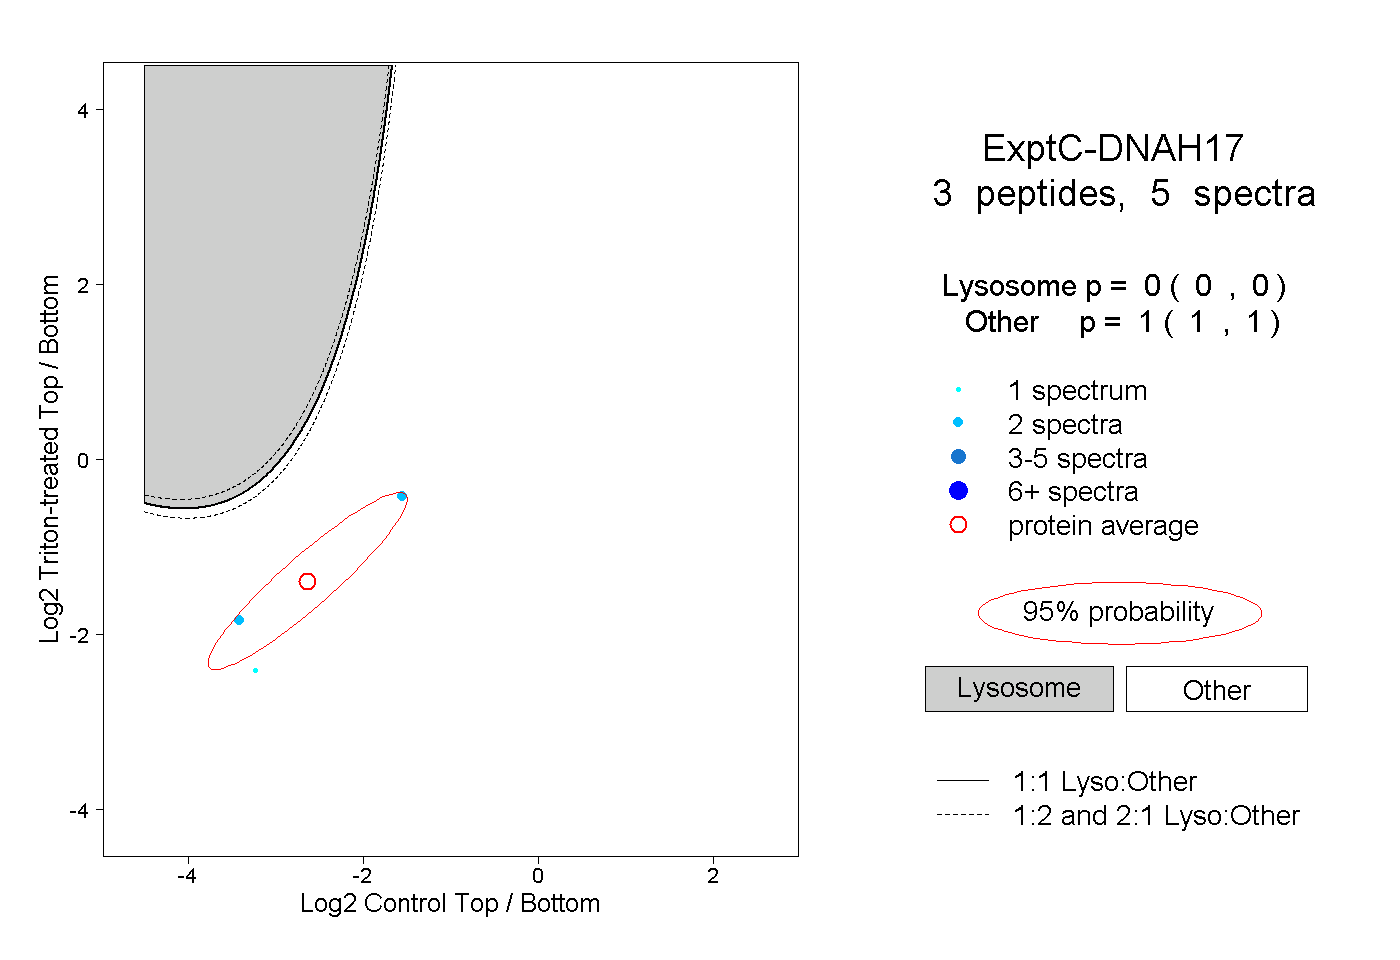
0.000 | 0.000
1.000 | 1.000
1peptide
spectra
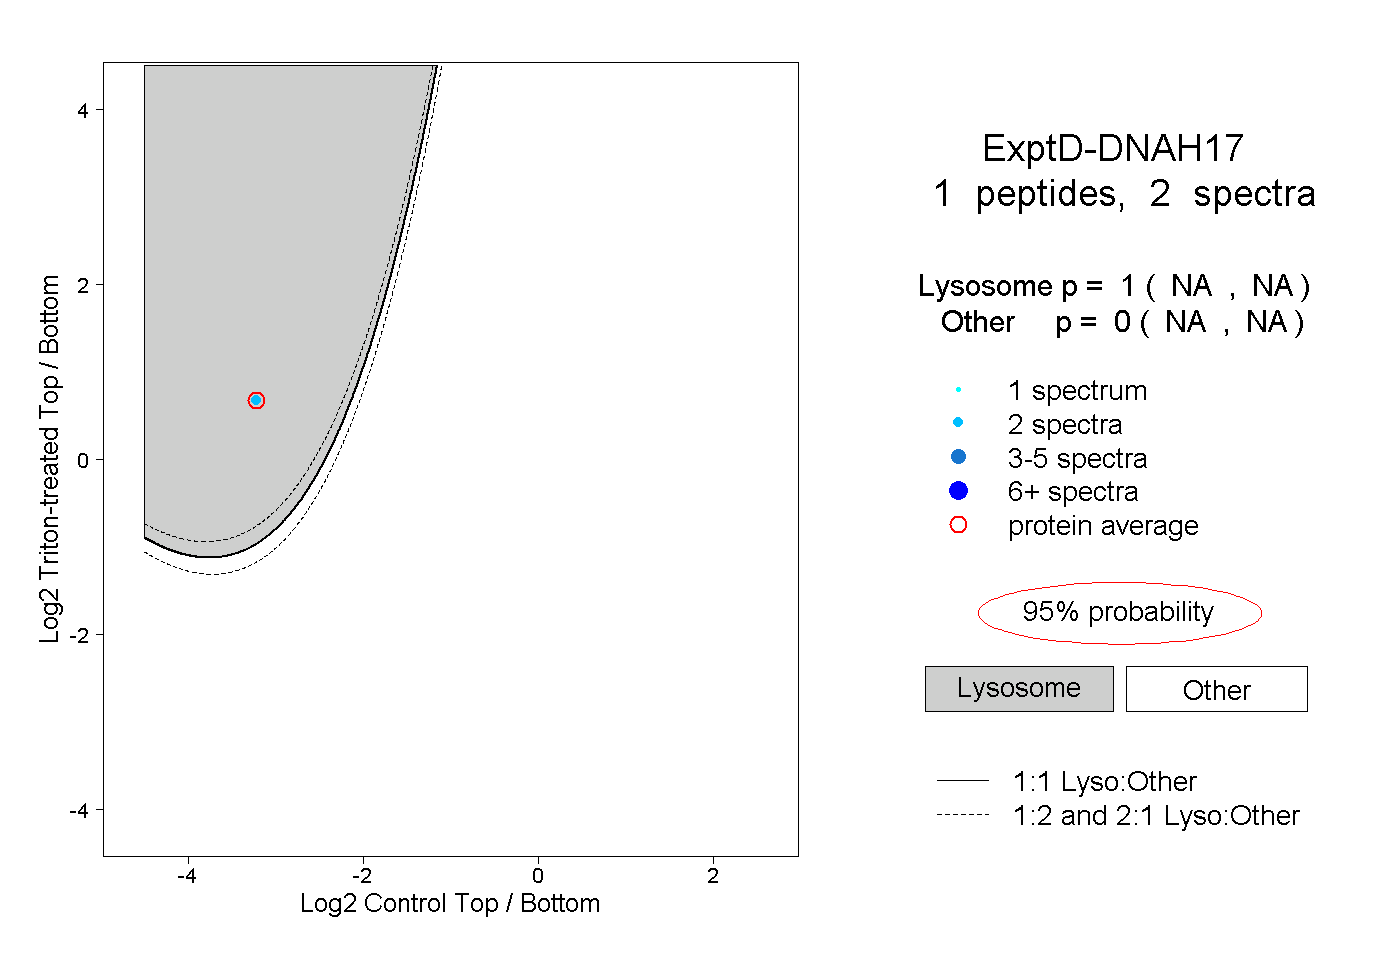
NA | NA
NA | NA