 3
3peptides
spectra
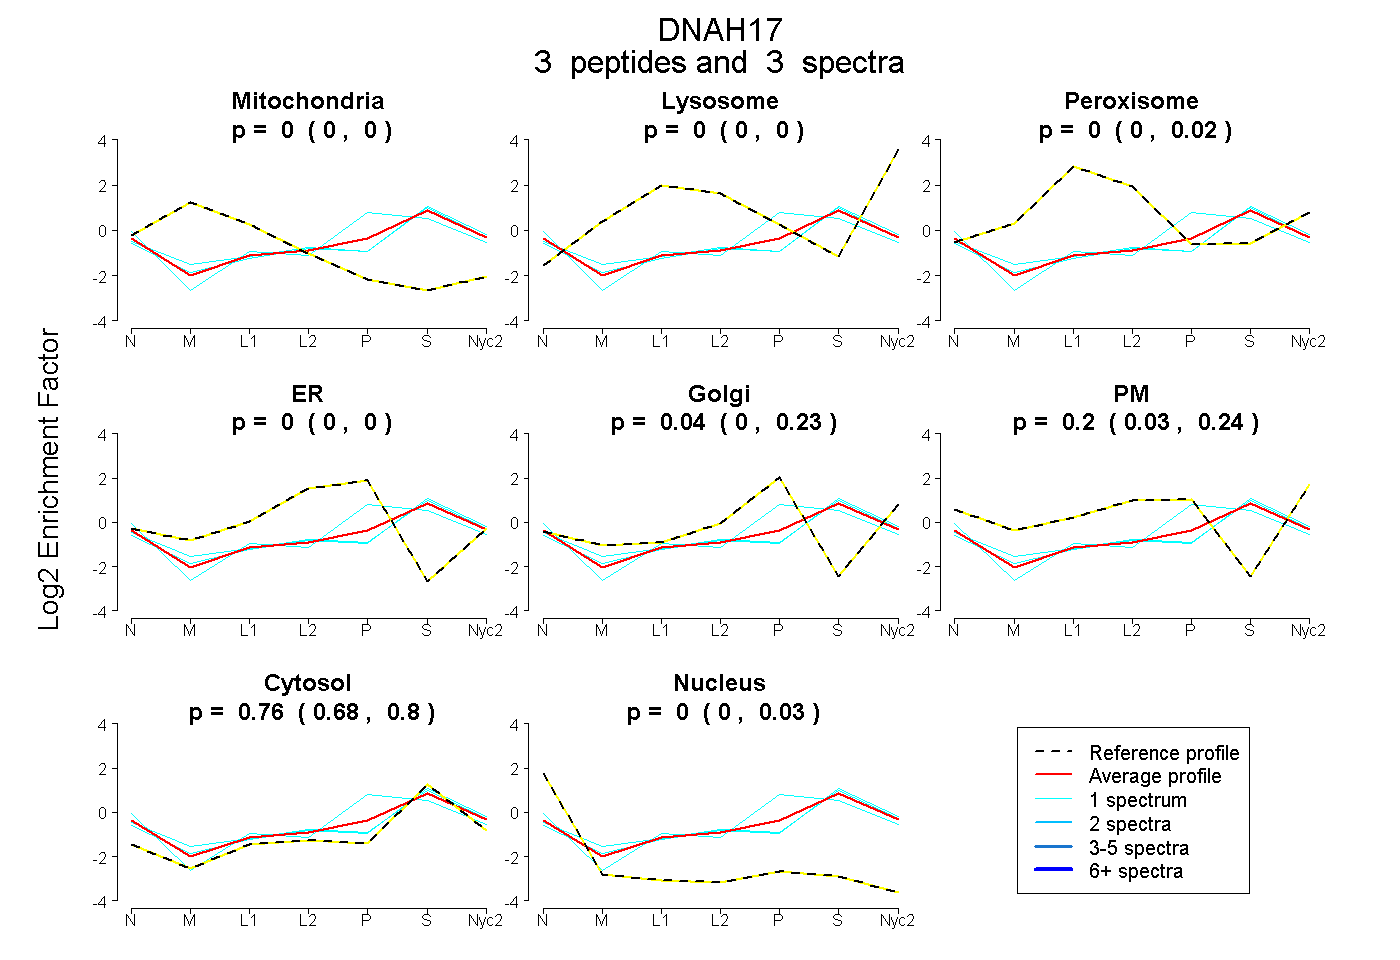
0.000 | 0.000
0.000 | 0.000
0.000 | 0.025
0.000 | 0.000
0.000 | 0.235
0.027 | 0.237
0.678 | 0.795
0.000 | 0.029
| Plot | Mito | Lyso | Perox | ER | Golgi | PM | Cytosol | Nucleus | |||||
| Expt A |
3 peptides |
3 spectra |
|
0.000 0.000 | 0.000 |
0.000 0.000 | 0.000 |
0.000 0.000 | 0.025 |
0.000 0.000 | 0.000 |
0.038 0.000 | 0.235 |
0.200 0.027 | 0.237 |
0.762 0.678 | 0.795 |
0.000 0.000 | 0.029 |
| 1 spectrum, MTYAVK | 0.000 | 0.000 | 0.013 | 0.000 | 0.000 | 0.177 | 0.811 | 0.000 | ||
| 1 spectrum, MDDIYK | 0.000 | 0.000 | 0.000 | 0.000 | 0.370 | 0.000 | 0.620 | 0.010 | ||
| 1 spectrum, MTHPVK | 0.014 | 0.000 | 0.044 | 0.000 | 0.000 | 0.172 | 0.770 | 0.000 |
| Plot | Lyso | Other | |||||||||||
| Expt C |
3 peptides |
5 spectra |
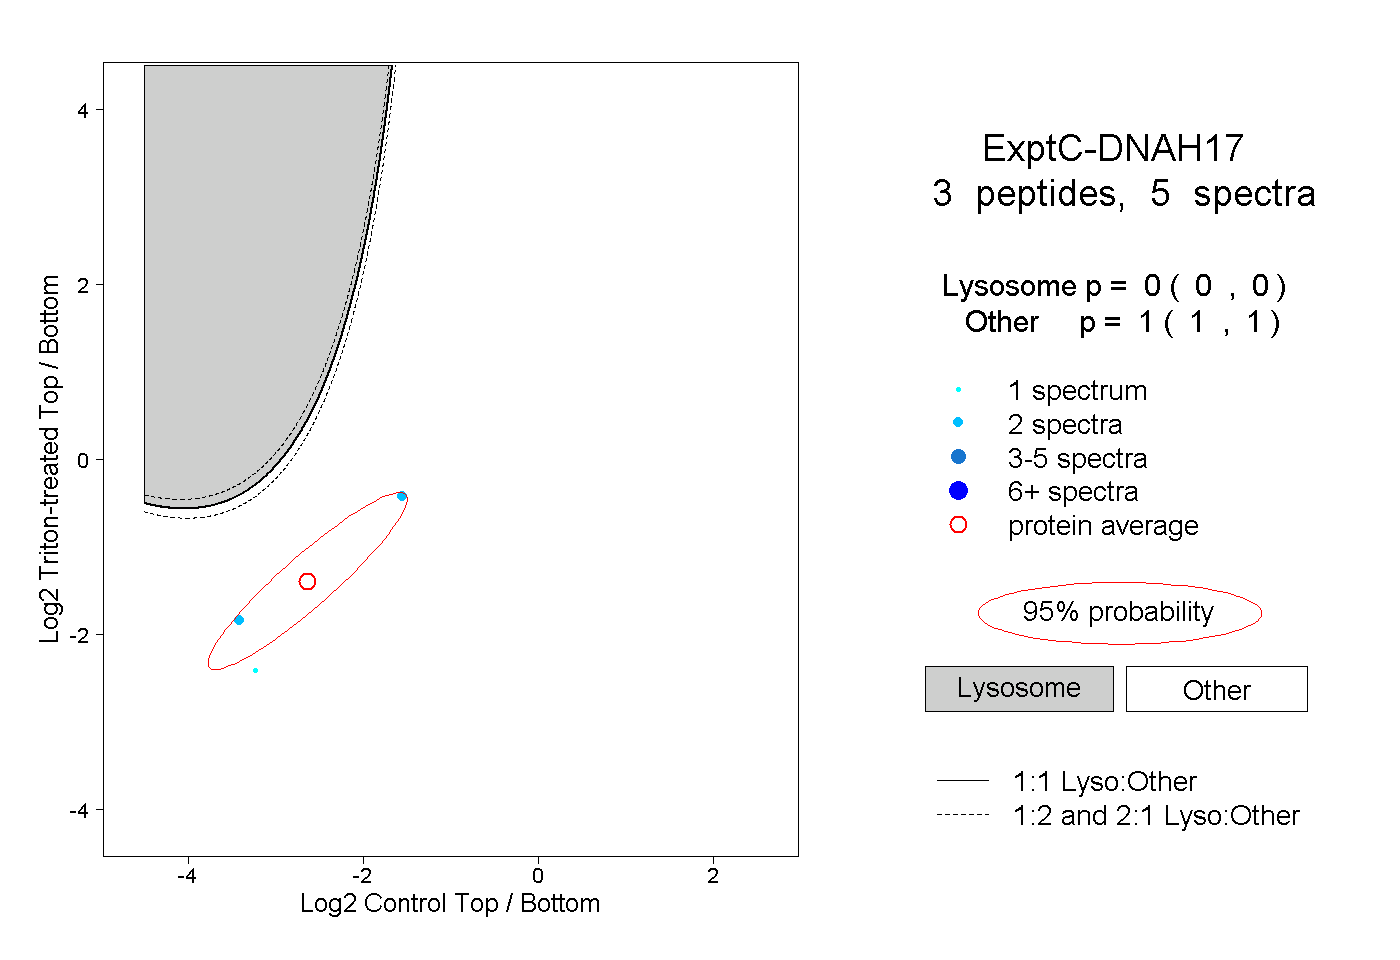 |
0.000 0.000 | 0.000 |
1.000 1.000 | 1.000 |
||||||||
| Plot | Lyso | Other | |||||||||||
| Expt D |
1 peptide |
2 spectra |
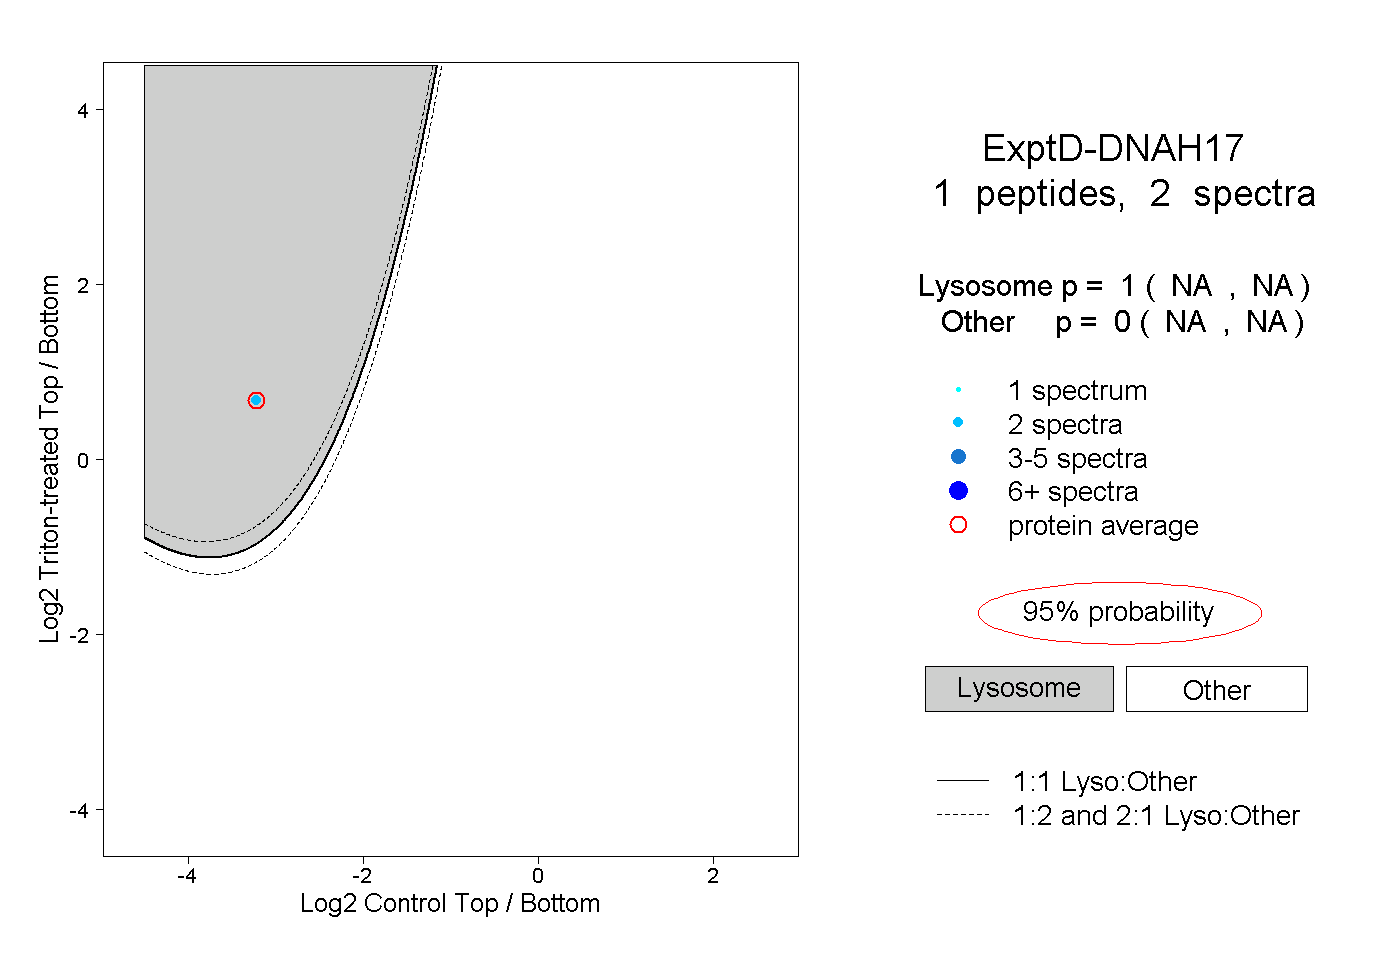 |
1.000 NA | NA |
0.000 NA | NA |