 3
3peptides
spectra
0.000 | 0.168
0.000 | 0.074
0.000 | 0.250
0.000 | 0.000
0.000 | 0.000
0.000 | 0.337
0.480 | 0.567
0.003 | 0.204
1peptide
spectrum
NA | NA
NA | NA
| Plot | Mito | Lyso | Perox | ER | Golgi | PM | Cytosol | Nucleus | |||||
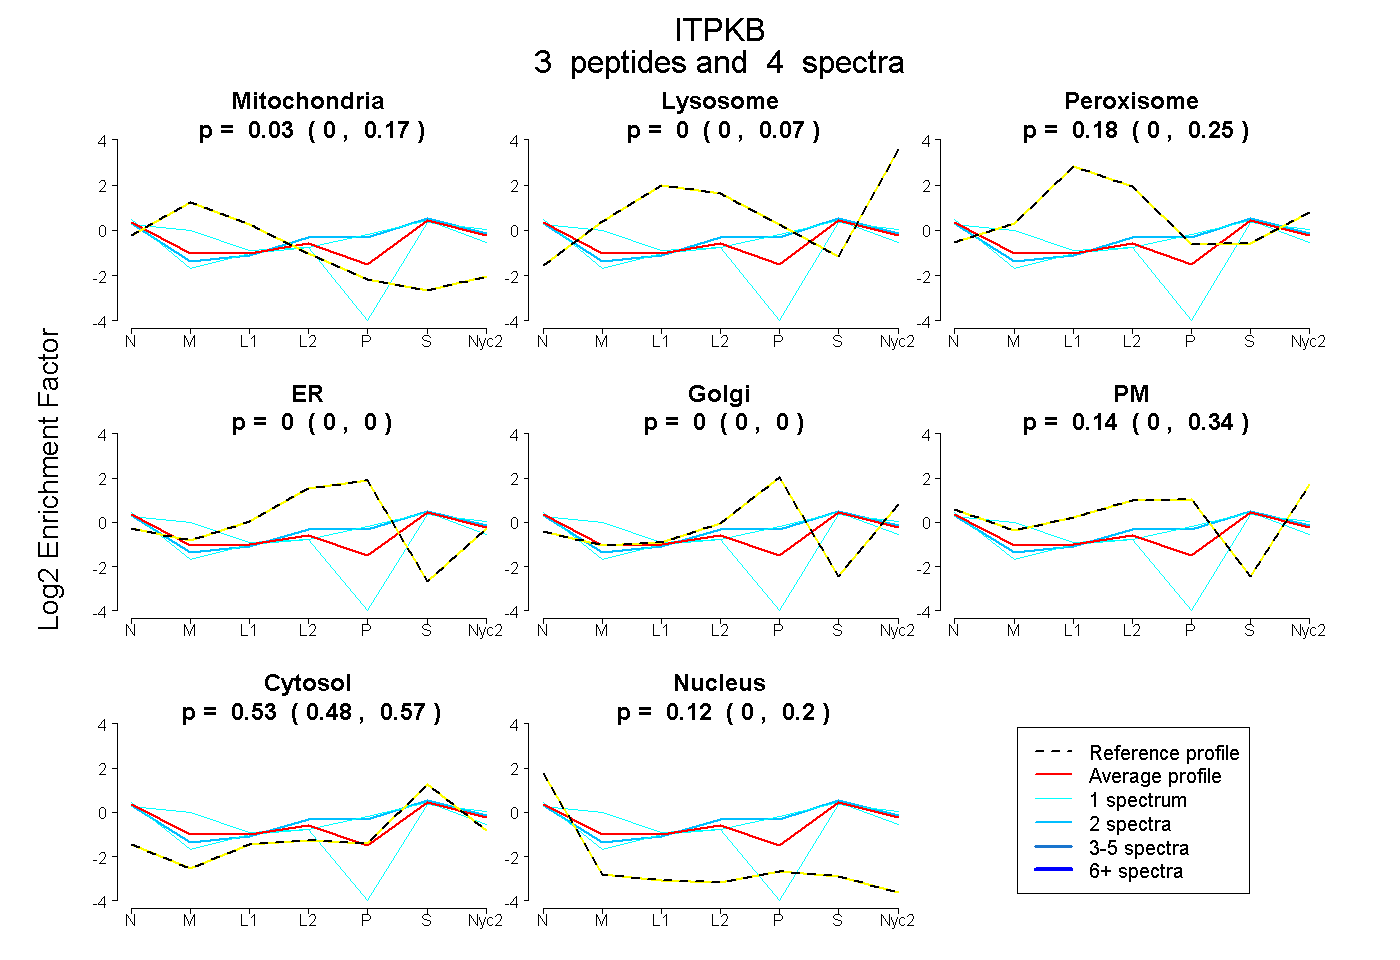
| Expt A |
3 peptides |
4 spectra |
|
0.035 0.000 | 0.168 |
0.000 0.000 | 0.074 |
0.177 0.000 | 0.250 |
0.000 0.000 | 0.000 |
0.000 0.000 | 0.000 |
0.139 0.000 | 0.337 |
0.525 0.480 | 0.567 |
0.124 0.003 | 0.204 |
||
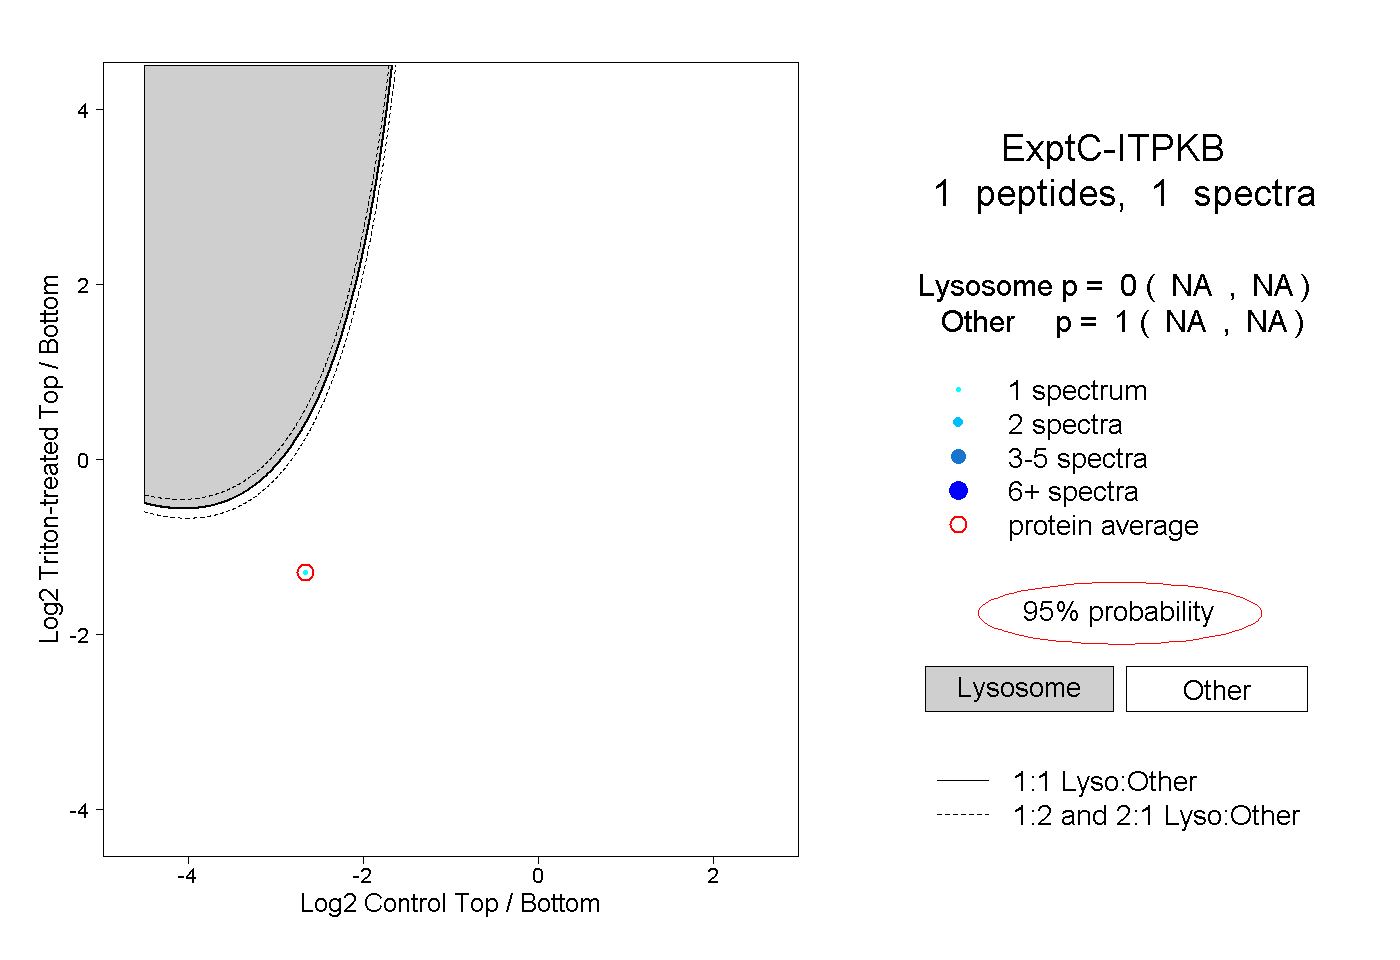
| Plot | Lyso | Other | |||||||||||
| Expt C |
1 peptide |
1 spectrum |
|
0.000 NA | NA |
1.000 NA | NA |