 3
3peptides
spectra
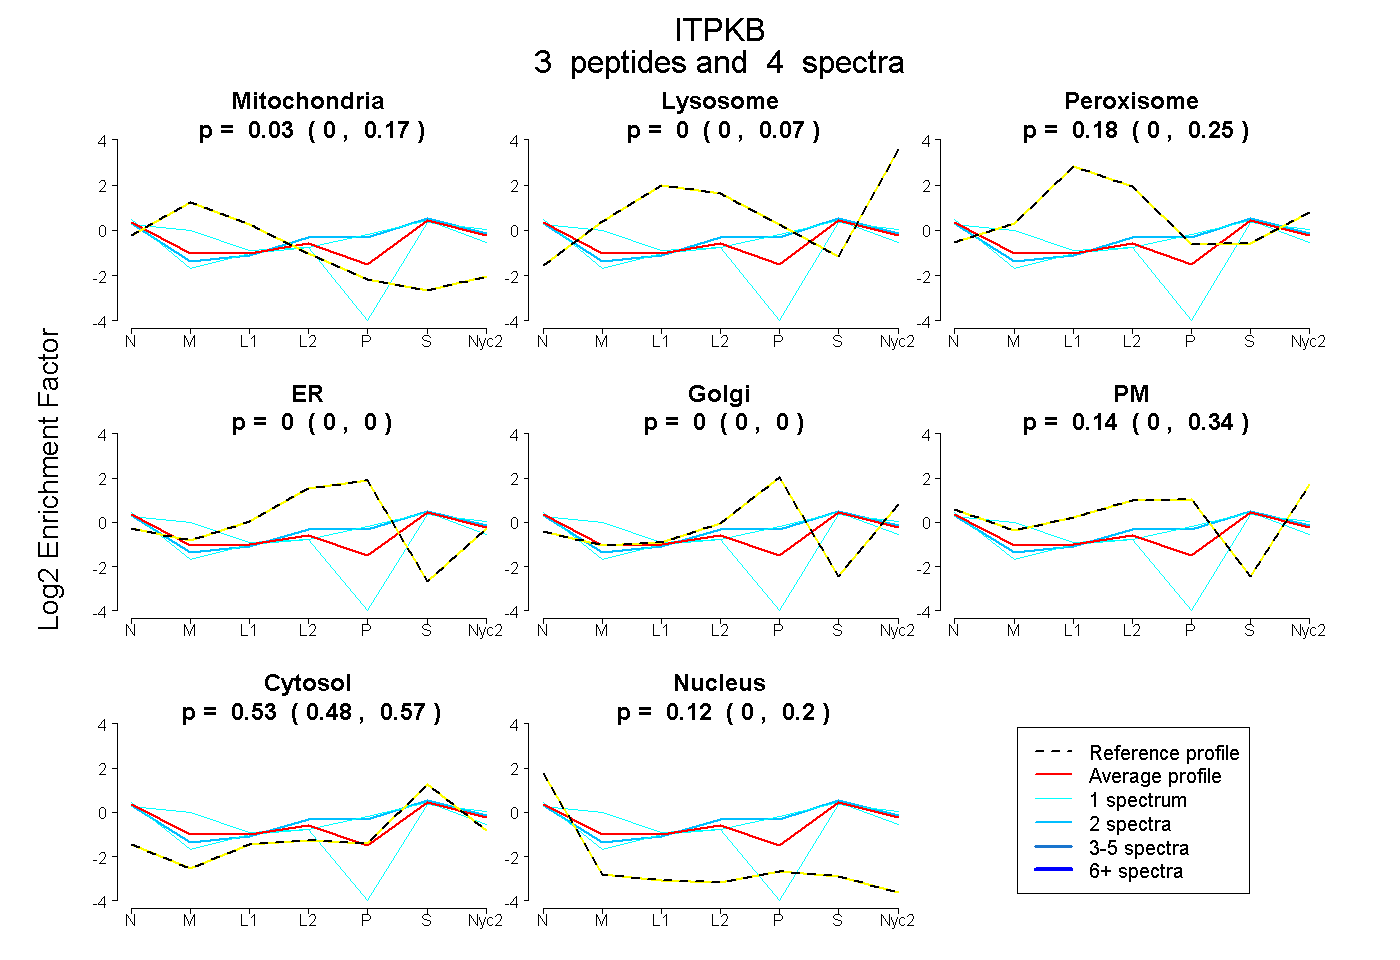
0.000 | 0.168
0.000 | 0.074
0.000 | 0.250
0.000 | 0.000
0.000 | 0.000
0.000 | 0.337
0.480 | 0.567
0.003 | 0.204
| Plot | Mito | Lyso | Perox | ER | Golgi | PM | Cytosol | Nucleus | |||||
| Expt A |
3 peptides |
4 spectra |
|
0.035 0.000 | 0.168 |
0.000 0.000 | 0.074 |
0.177 0.000 | 0.250 |
0.000 0.000 | 0.000 |
0.000 0.000 | 0.000 |
0.139 0.000 | 0.337 |
0.525 0.480 | 0.567 |
0.124 0.003 | 0.204 |
| 1 spectrum, RPEEGTVDAQSSELSENPR | 0.438 | 0.026 | 0.039 | 0.000 | 0.000 | 0.000 | 0.497 | 0.000 | ||
| 1 spectrum, MVEVDPEAPTEEEK | 0.000 | 0.000 | 0.000 | 0.000 | 0.000 | 0.324 | 0.585 | 0.091 | ||
| 2 spectra, AVTKPR | 0.000 | 0.000 | 0.000 | 0.000 | 0.000 | 0.369 | 0.605 | 0.026 |
| Plot | Lyso | Other | |||||||||||
| Expt C |
1 peptide |
1 spectrum |
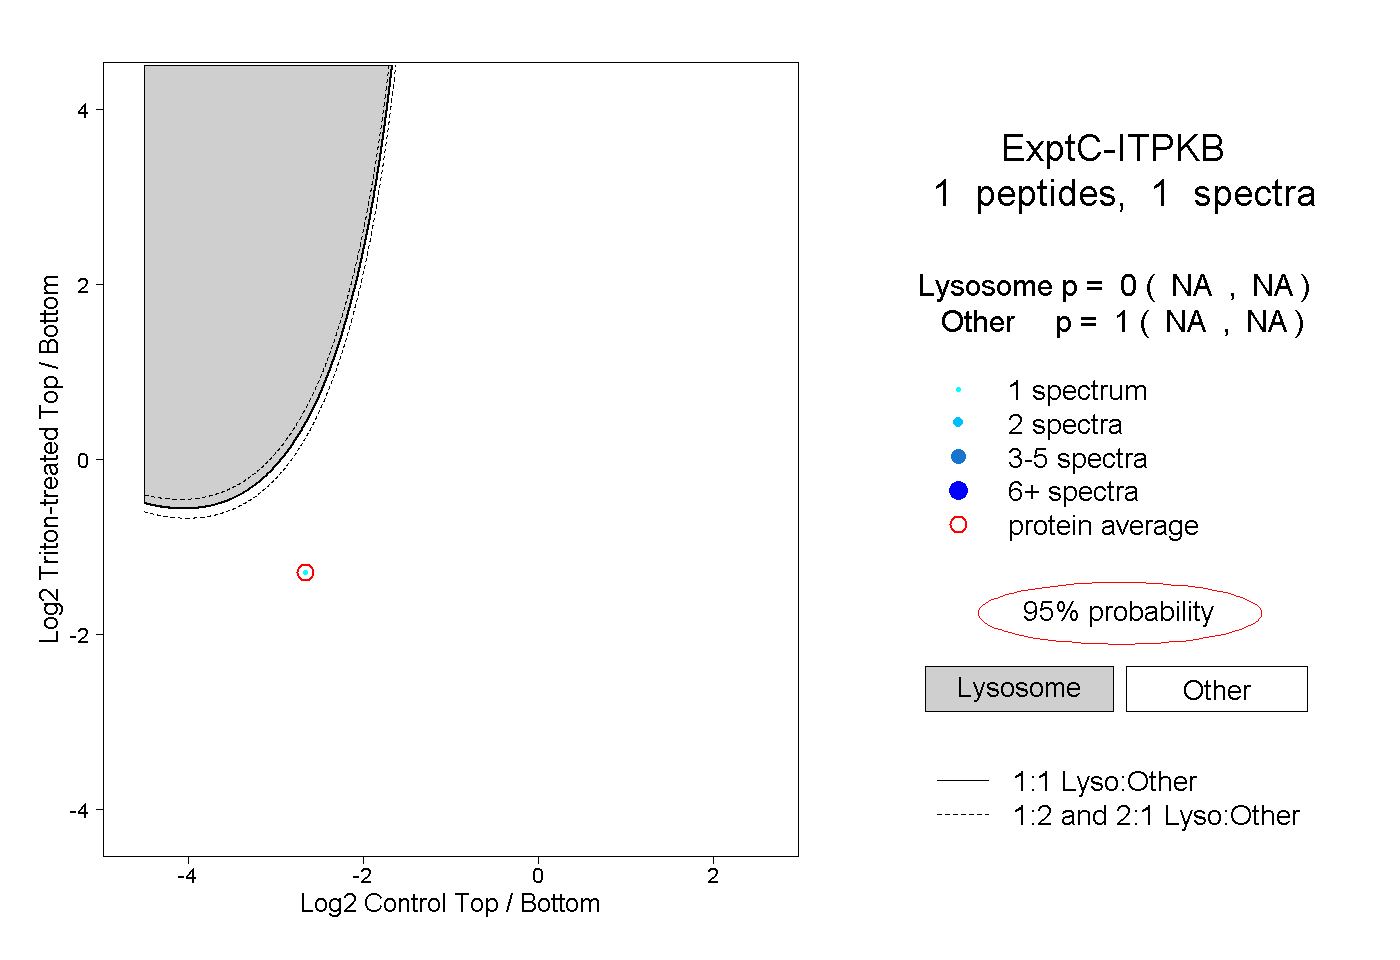 |
0.000 NA | NA |
1.000 NA | NA |