 5
5peptides
spectra
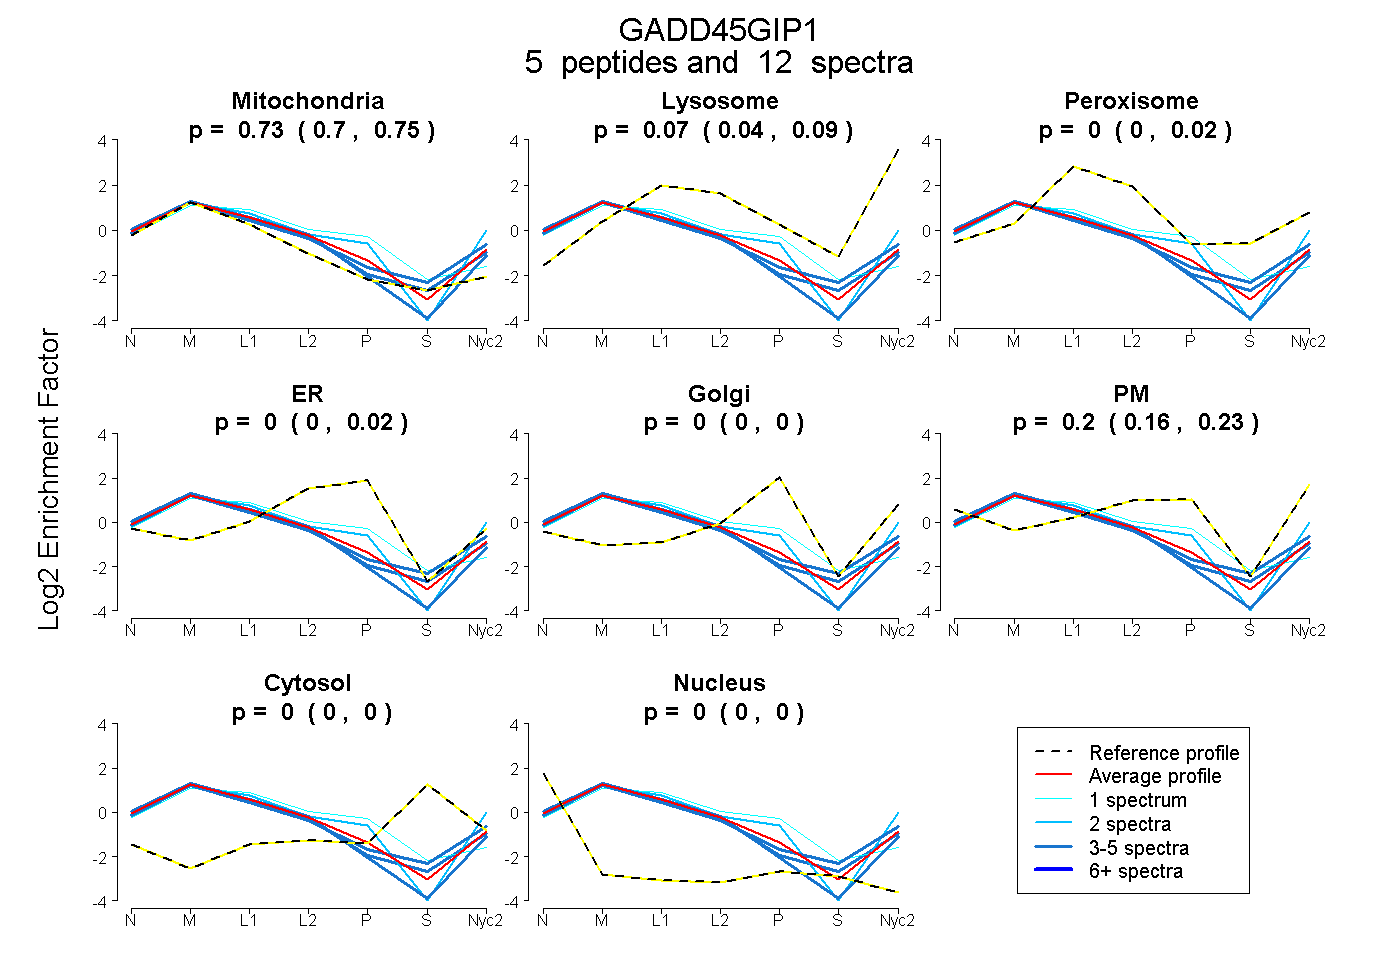
0.700 | 0.748
0.038 | 0.092
0.000 | 0.016
0.000 | 0.019
0.000 | 0.000
0.163 | 0.233
0.000 | 0.000
0.000 | 0.000
2peptides
spectra
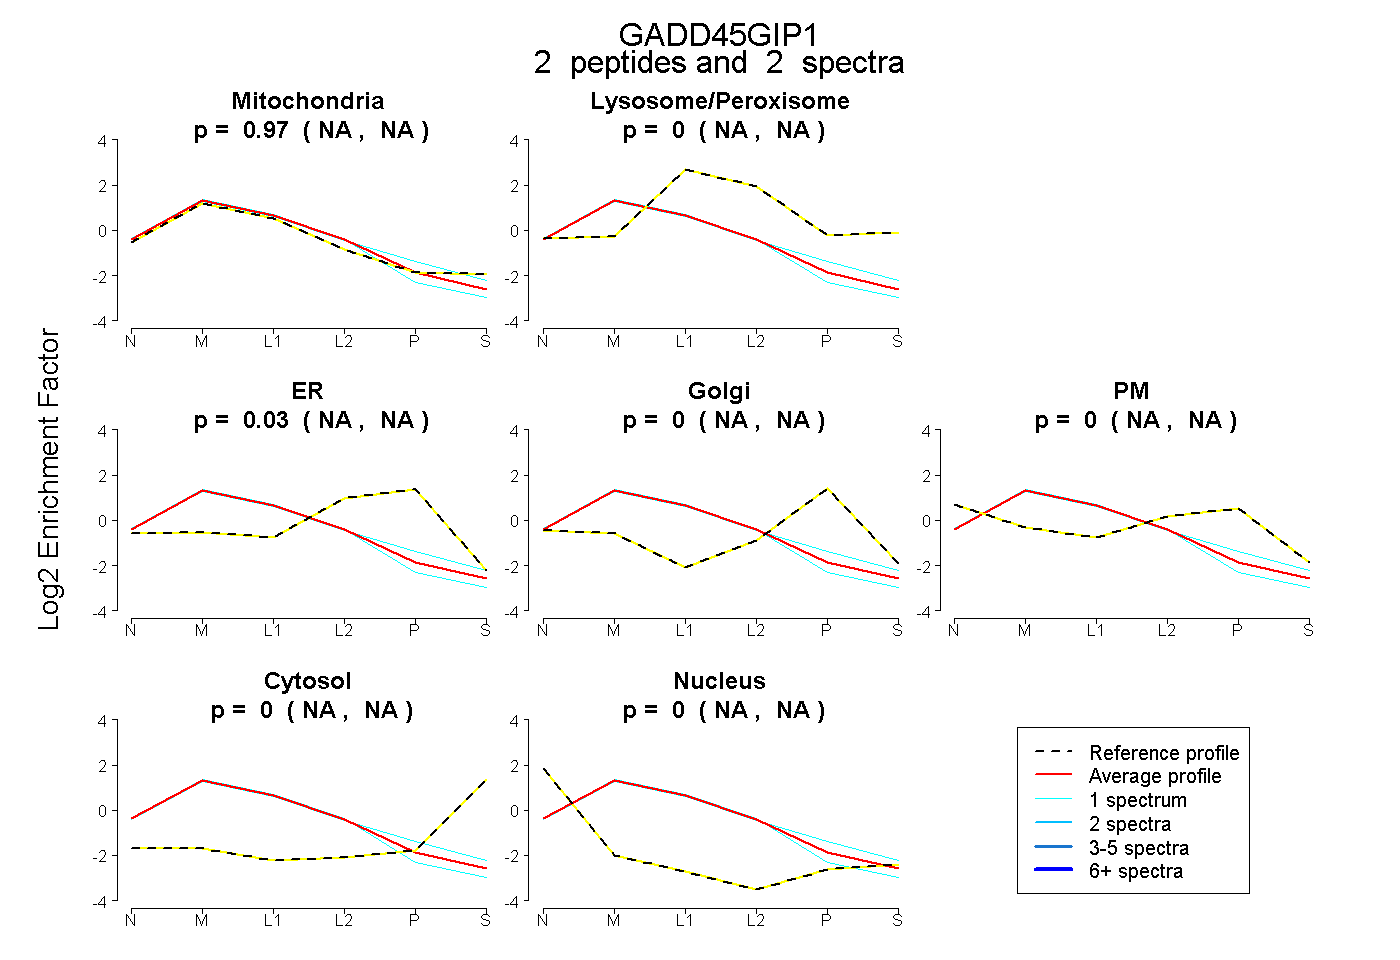
NA | NA
NA | NA
NA | NA
NA | NA
NA | NA
NA | NA
NA | NA
5peptides
spectra
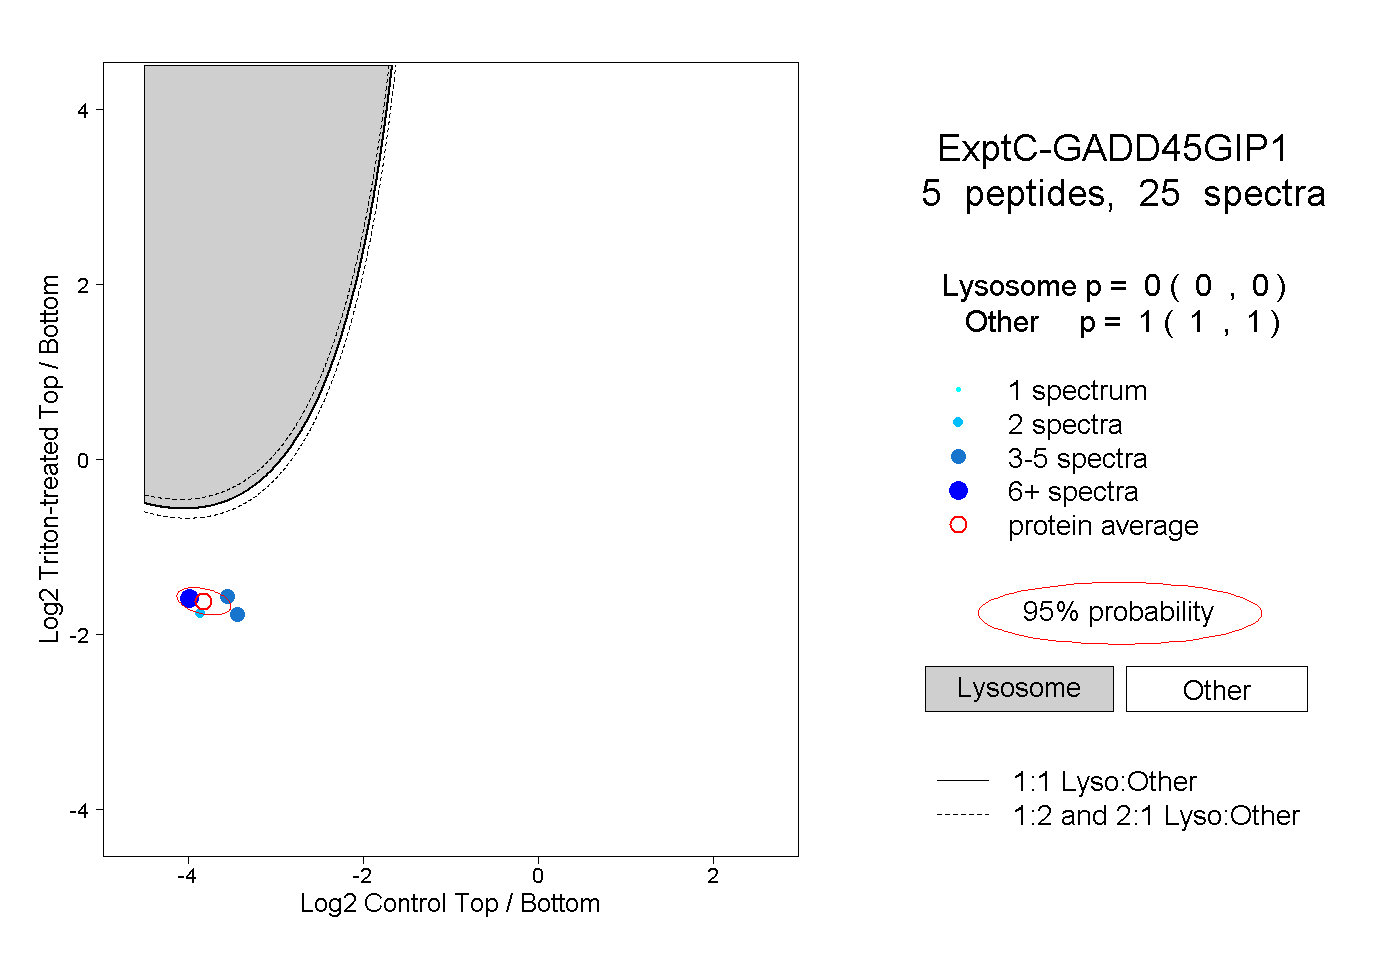
0.000 | 0.000
1.000 | 1.000
2peptides
spectra
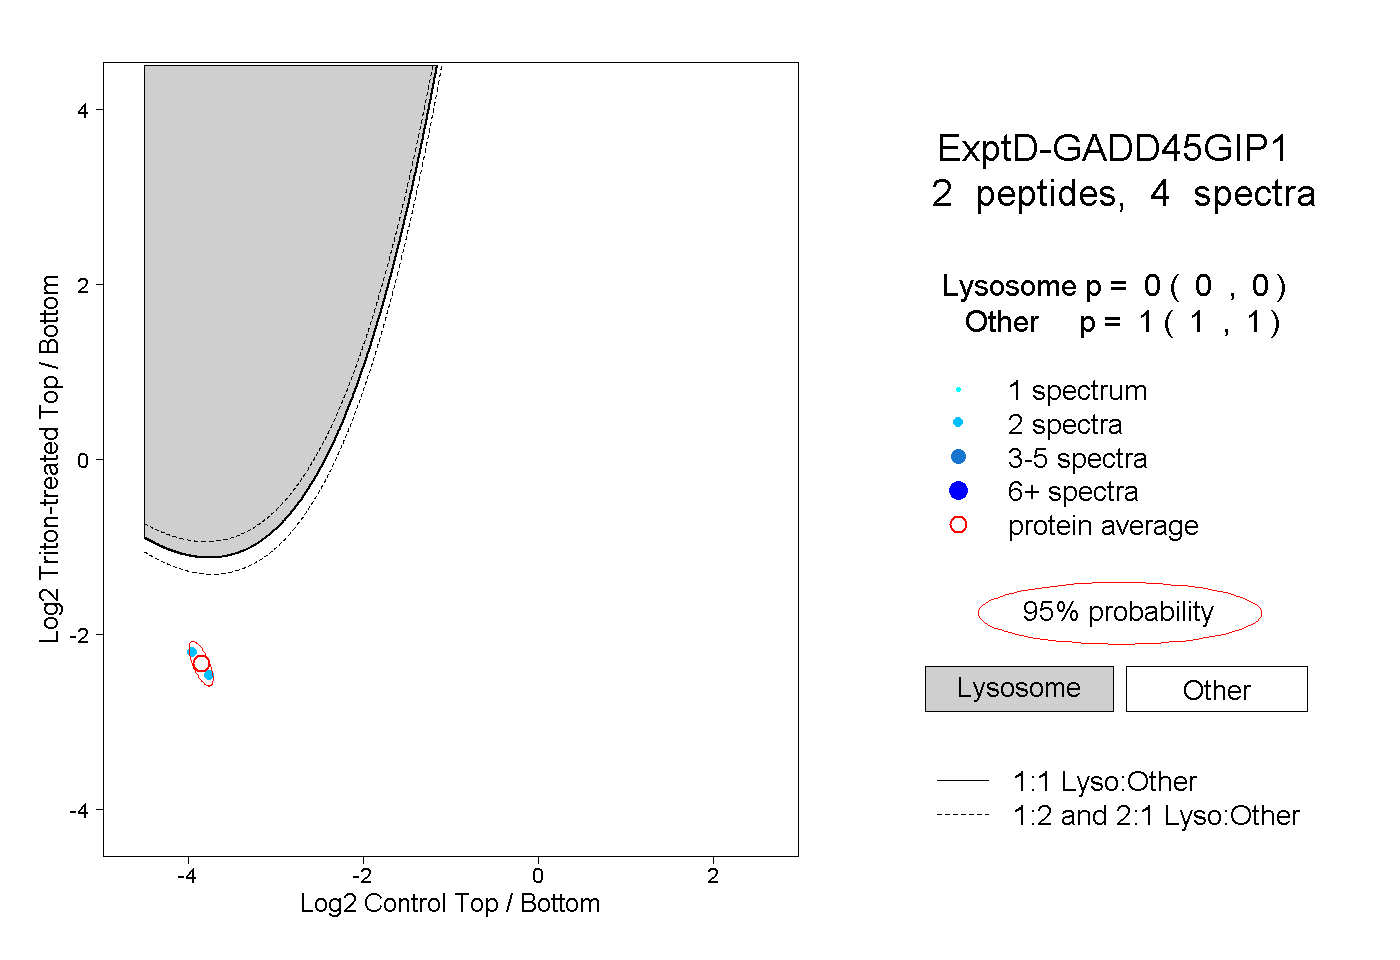
0.000 | 0.000
1.000 | 1.000