 5
5peptides
spectra
0.700 | 0.748
0.038 | 0.092
0.000 | 0.016
0.000 | 0.019
0.000 | 0.000
0.163 | 0.233
0.000 | 0.000
0.000 | 0.000
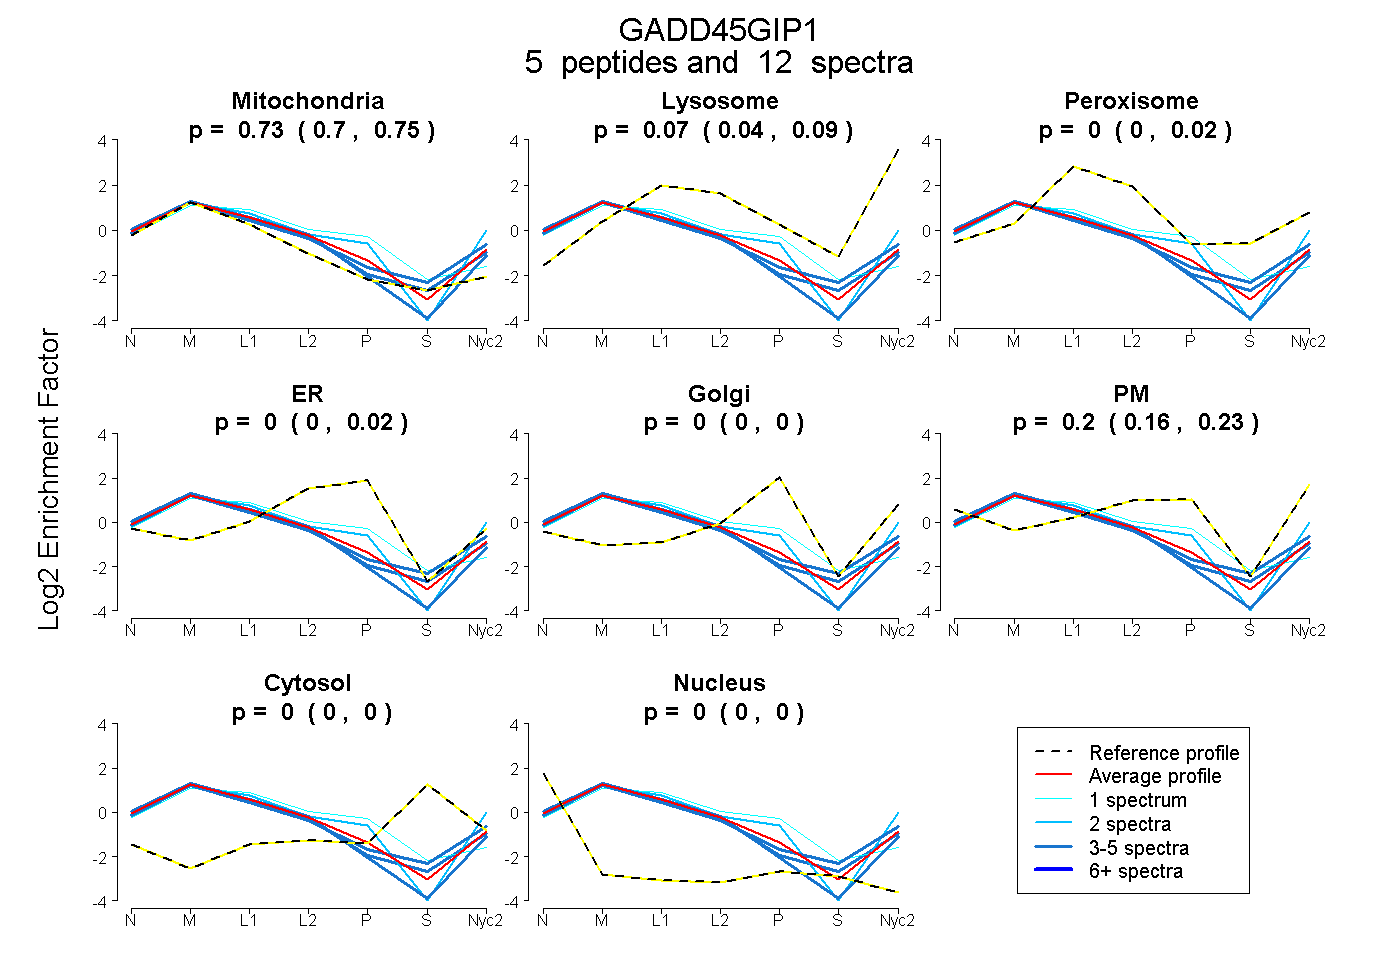
| Plot | Mito | Lyso | Perox | ER | Golgi | PM | Cytosol | Nucleus | |||||
| Expt A |
5 peptides |
12 spectra |
|
0.728 0.700 | 0.748 |
0.067 0.038 | 0.092 |
0.000 0.000 | 0.016 |
0.000 0.000 | 0.019 |
0.000 0.000 | 0.000 |
0.205 0.163 | 0.233 |
0.000 0.000 | 0.000 |
0.000 0.000 | 0.000 |
| 2 spectra, LQAEAQEQLGYHVDPR | 0.546 | 0.023 | 0.000 | 0.000 | 0.000 | 0.431 | 0.000 | 0.000 | ||
| 3 spectra, WQLTPR | 0.748 | 0.170 | 0.000 | 0.000 | 0.000 | 0.082 | 0.000 | 0.000 | ||
| 3 spectra, FQELLQDLDK | 0.809 | 0.113 | 0.015 | 0.000 | 0.000 | 0.064 | 0.000 | 0.000 | ||
| 3 spectra, VQQQAAEAR | 0.827 | 0.000 | 0.000 | 0.000 | 0.000 | 0.173 | 0.000 | 0.000 | ||
| 1 spectrum, MPQMIENWR | 0.576 | 0.000 | 0.144 | 0.280 | 0.000 | 0.000 | 0.000 | 0.000 |
| Plot | Mito | Lyso or Perox | ER | Golgi | PM | Cytosol | Nucleus | ||||||
| Expt B |
2 peptides |
2 spectra |
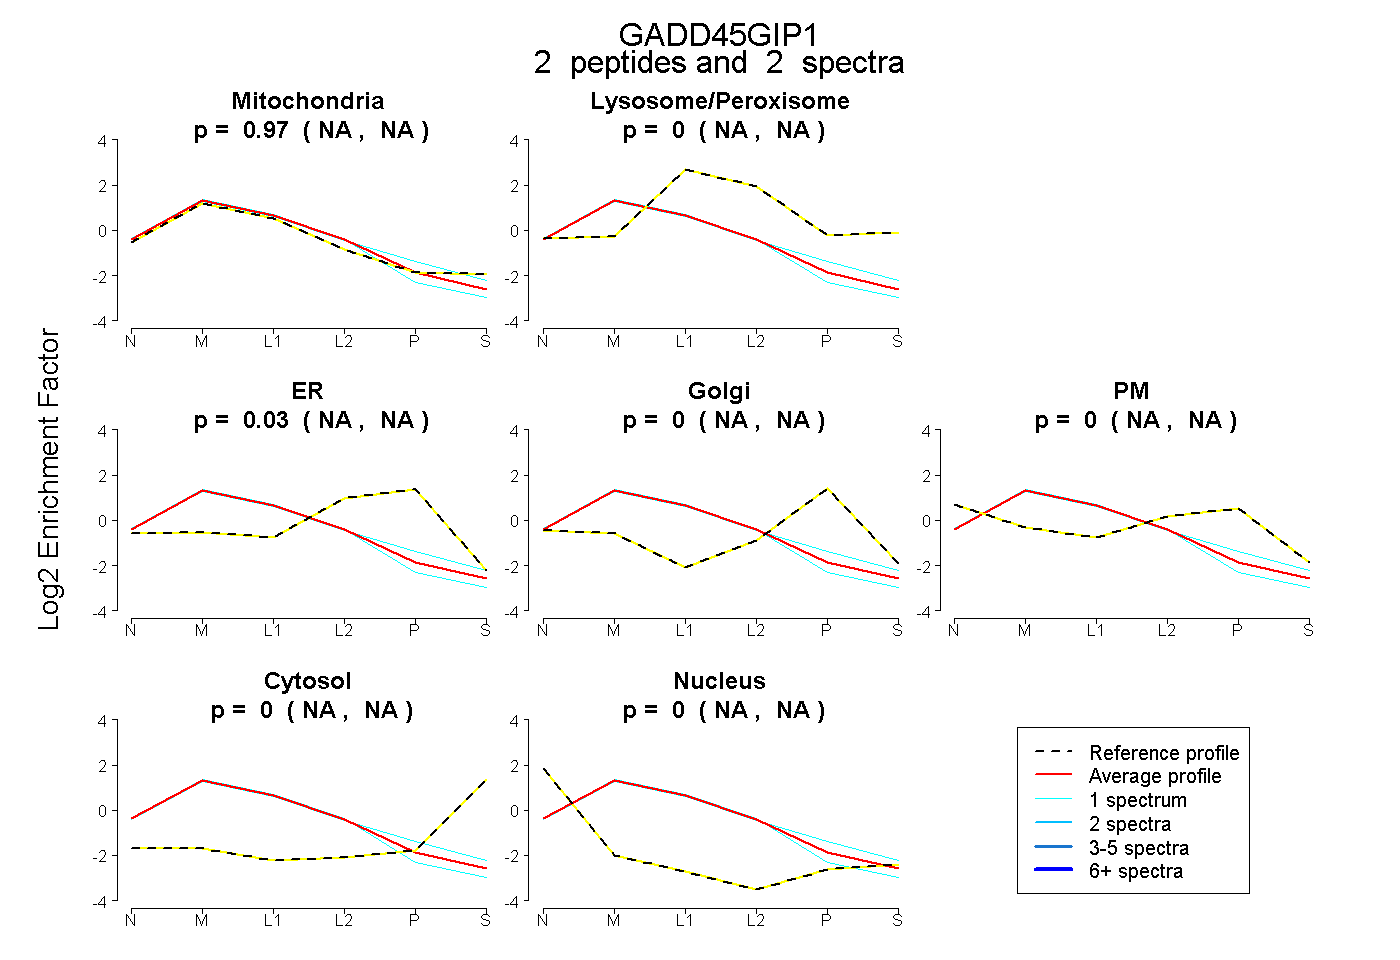 |
0.967 NA | NA |
0.000 NA | NA |
0.033 NA | NA |
0.000 NA | NA |
0.000 NA | NA |
0.000 NA | NA |
0.000 NA | NA |
|||
| Plot | Lyso | Other | |||||||||||
| Expt C |
5 peptides |
25 spectra |
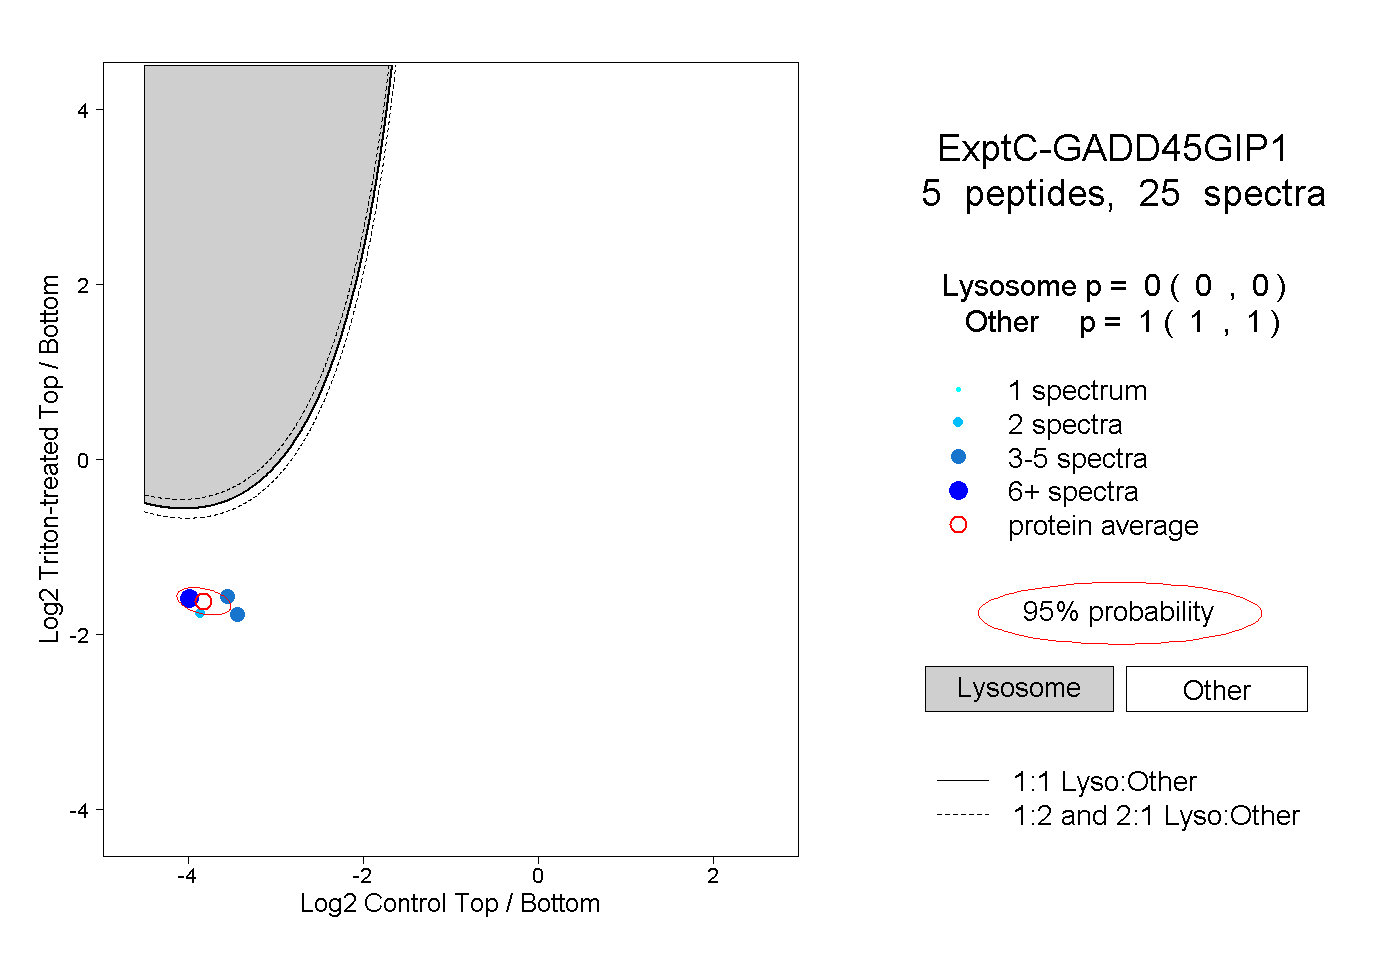 |
0.000 0.000 | 0.000 |
1.000 1.000 | 1.000 |
||||||||
| Plot | Lyso | Other | |||||||||||
| Expt D |
2 peptides |
4 spectra |
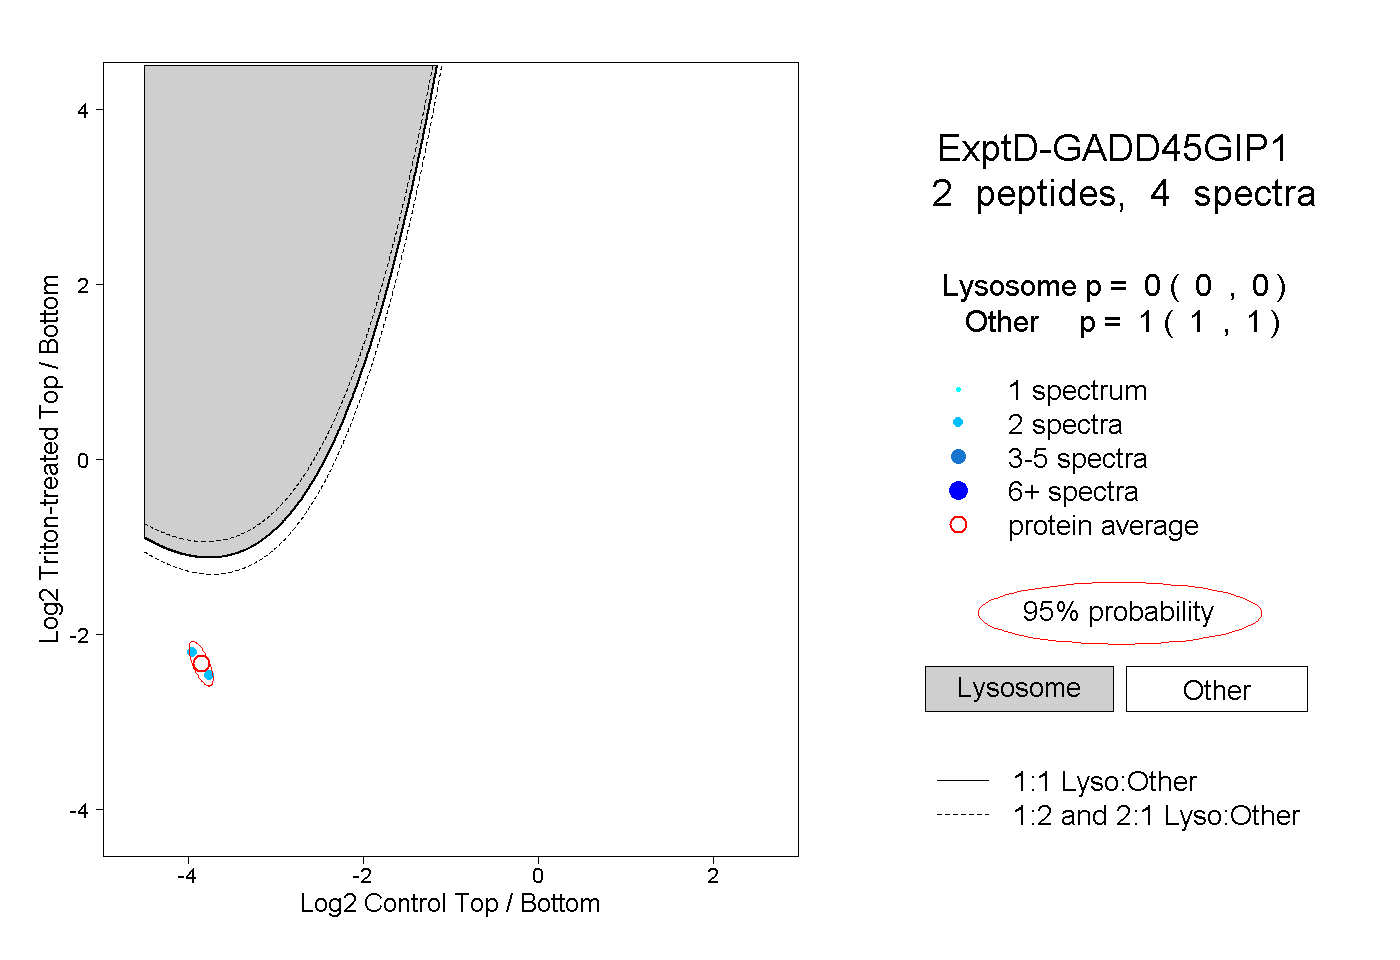 |
0.000 0.000 | 0.000 |
1.000 1.000 | 1.000 |