 5
5peptides
spectra
0.000 | 0.000
0.000 | 0.000
0.000 | 0.000
0.000 | 0.139
0.110 | 0.313
0.000 | 0.192
0.376 | 0.449
0.180 | 0.241
1peptide
spectrum
NA | NA
NA | NA
NA | NA
NA | NA
NA | NA
NA | NA
NA | NA
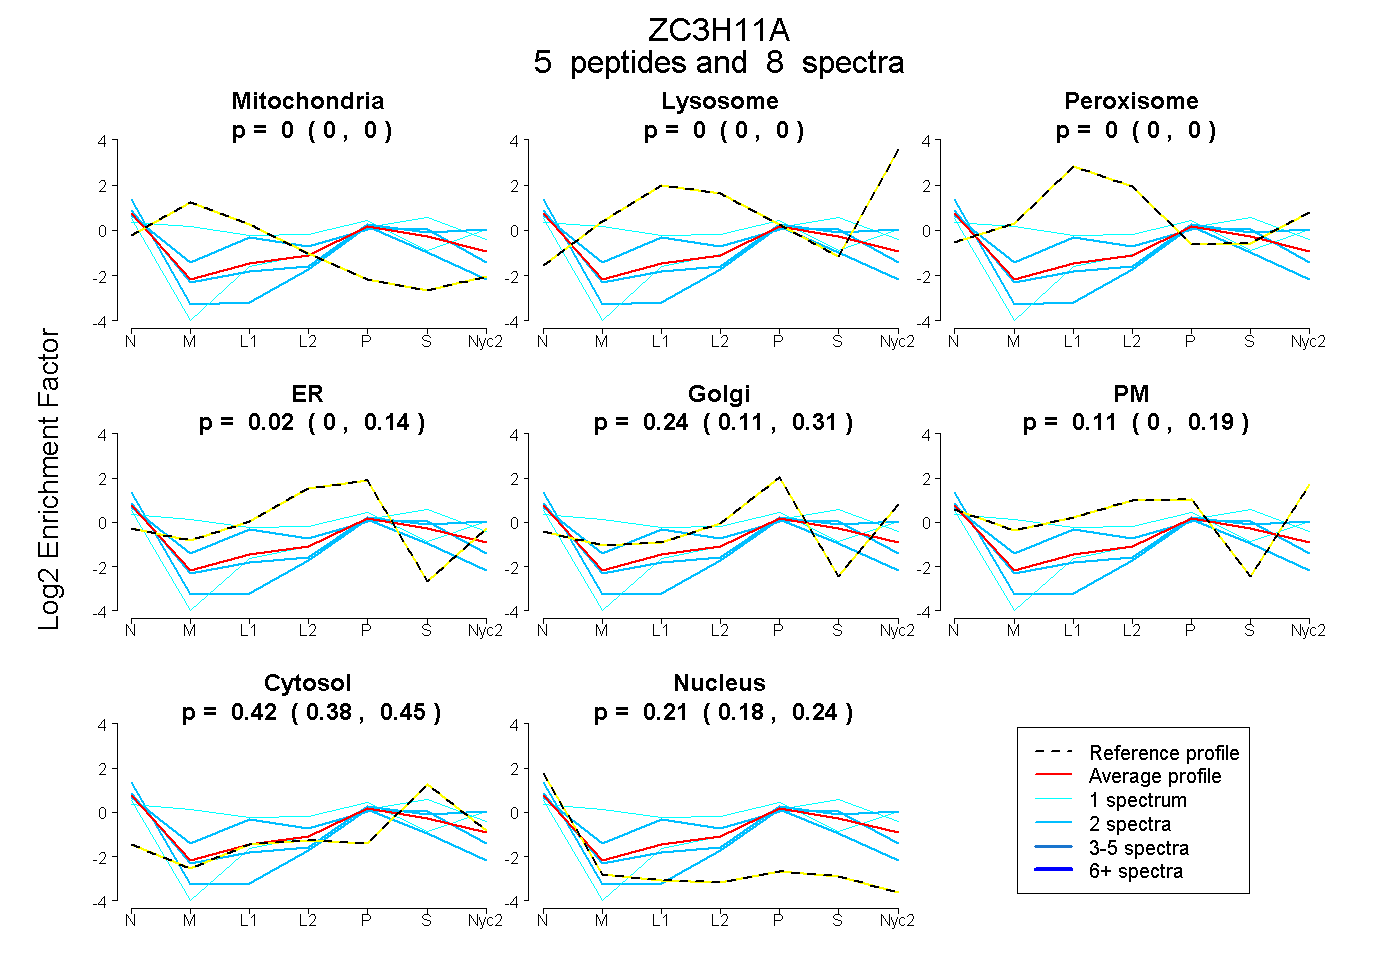
| Plot | Mito | Lyso | Perox | ER | Golgi | PM | Cytosol | Nucleus | |||||
| Expt A |
5 peptides |
8 spectra |
|
0.000 0.000 | 0.000 |
0.000 0.000 | 0.000 |
0.000 0.000 | 0.000 |
0.018 0.000 | 0.139 |
0.245 0.110 | 0.313 |
0.110 0.000 | 0.192 |
0.415 0.376 | 0.449 |
0.212 0.180 | 0.241 |
||
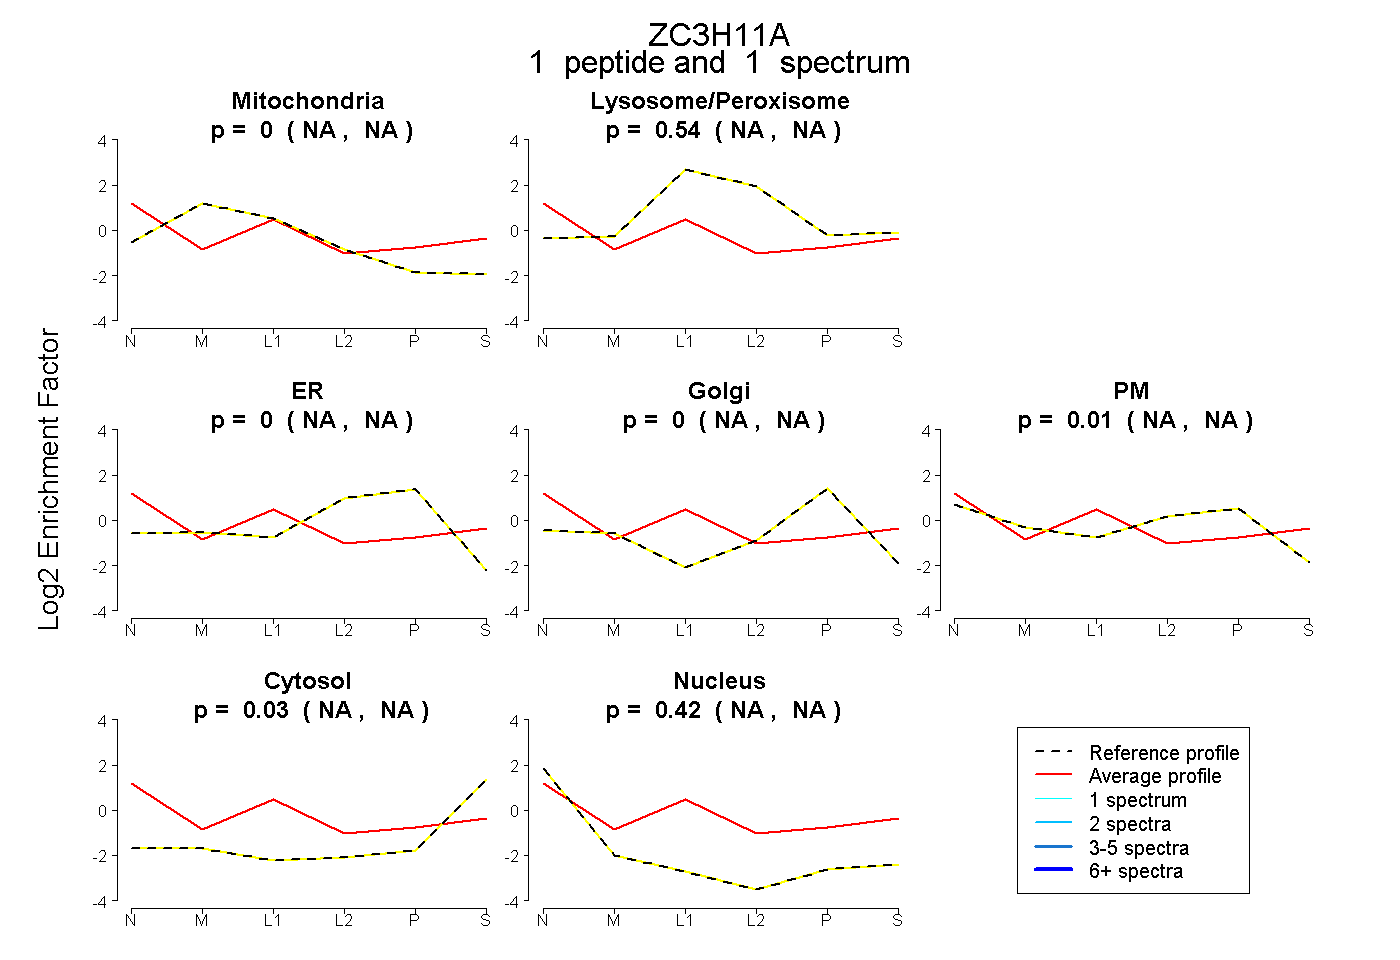
| Plot | Mito | Lyso or Perox | ER | Golgi | PM | Cytosol | Nucleus | ||||||
| Expt B |
1 peptide |
1 spectrum |
|
0.000 NA | NA |
0.541 NA | NA |
0.000 NA | NA |
0.000 NA | NA |
0.005 NA | NA |
0.035 NA | NA |
0.419 NA | NA |