 8
8peptides
spectra
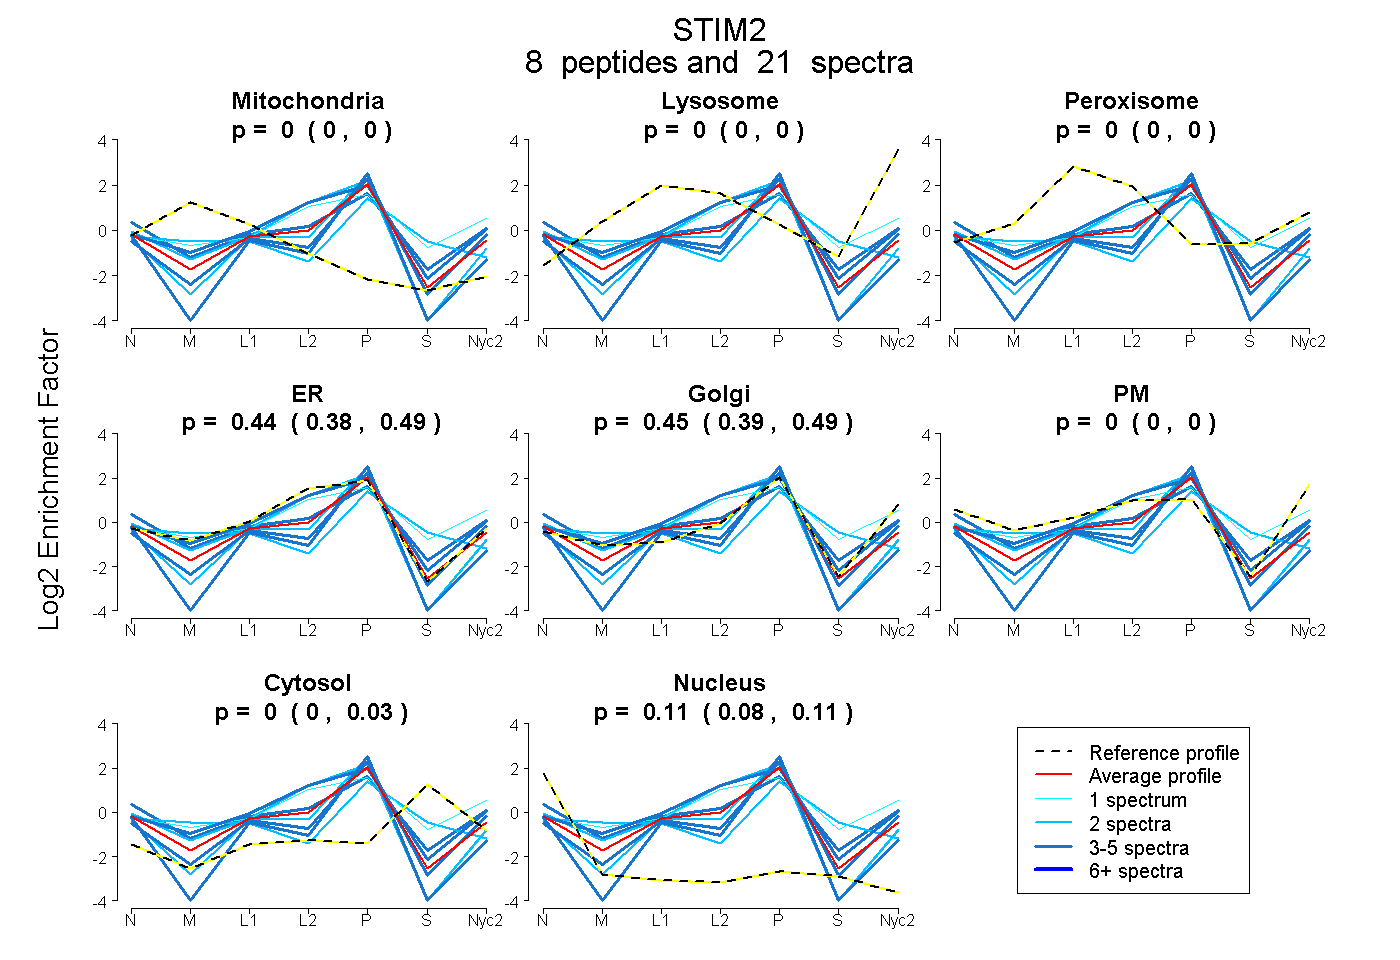
0.000 | 0.000
0.000 | 0.000
0.000 | 0.000
0.385 | 0.492
0.389 | 0.494
0.000 | 0.000
0.000 | 0.032
0.084 | 0.115
3peptides
spectra
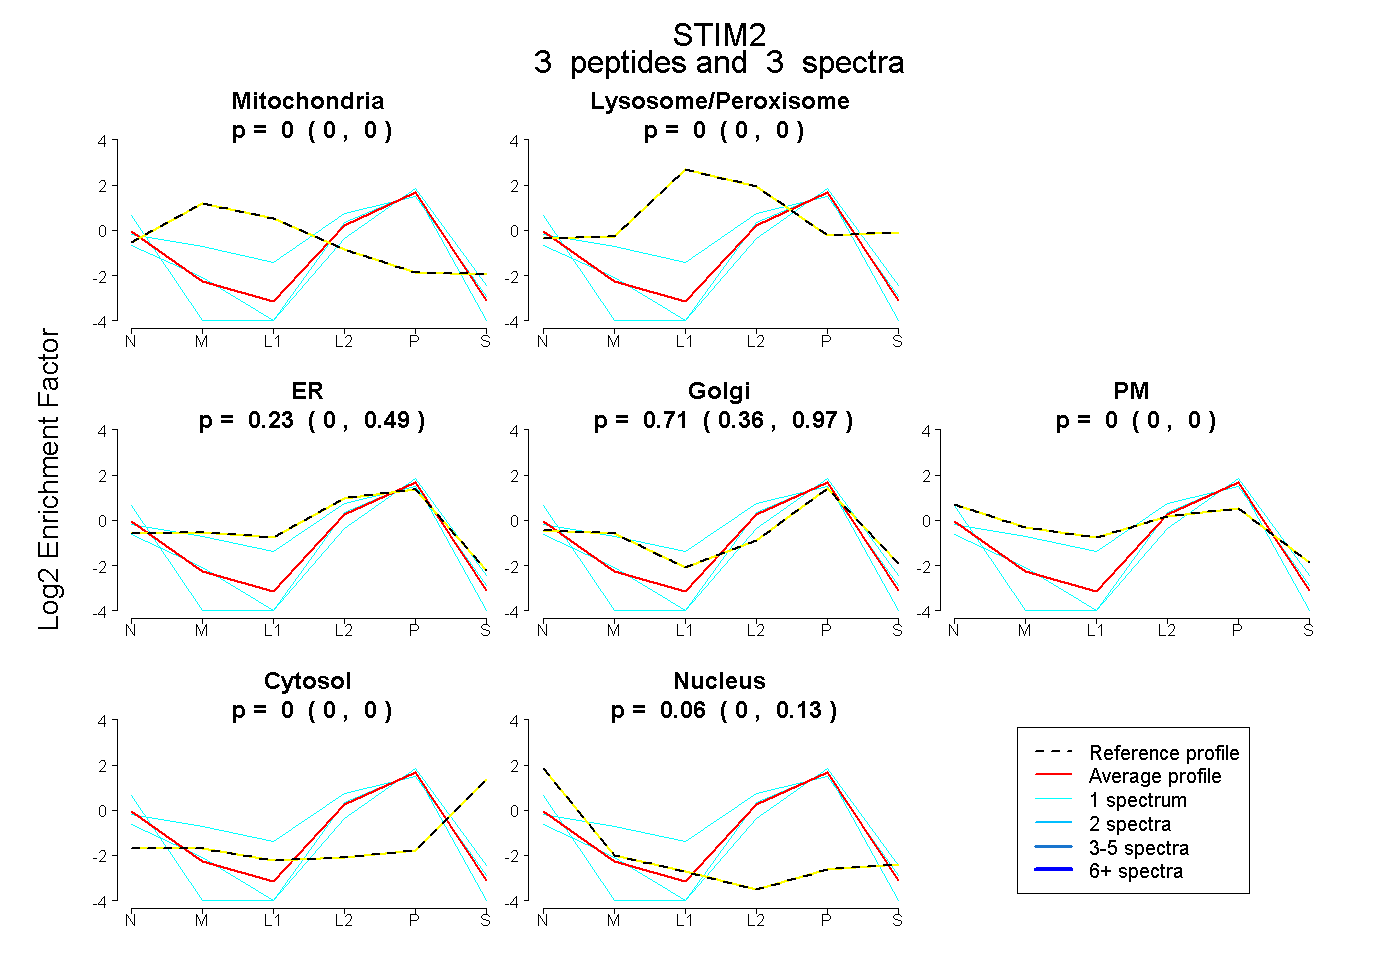
0.000 | 0.000
0.000 | 0.000
0.000 | 0.486
0.361 | 0.967
0.000 | 0.000
0.000 | 0.000
0.000 | 0.126
6peptides
spectra
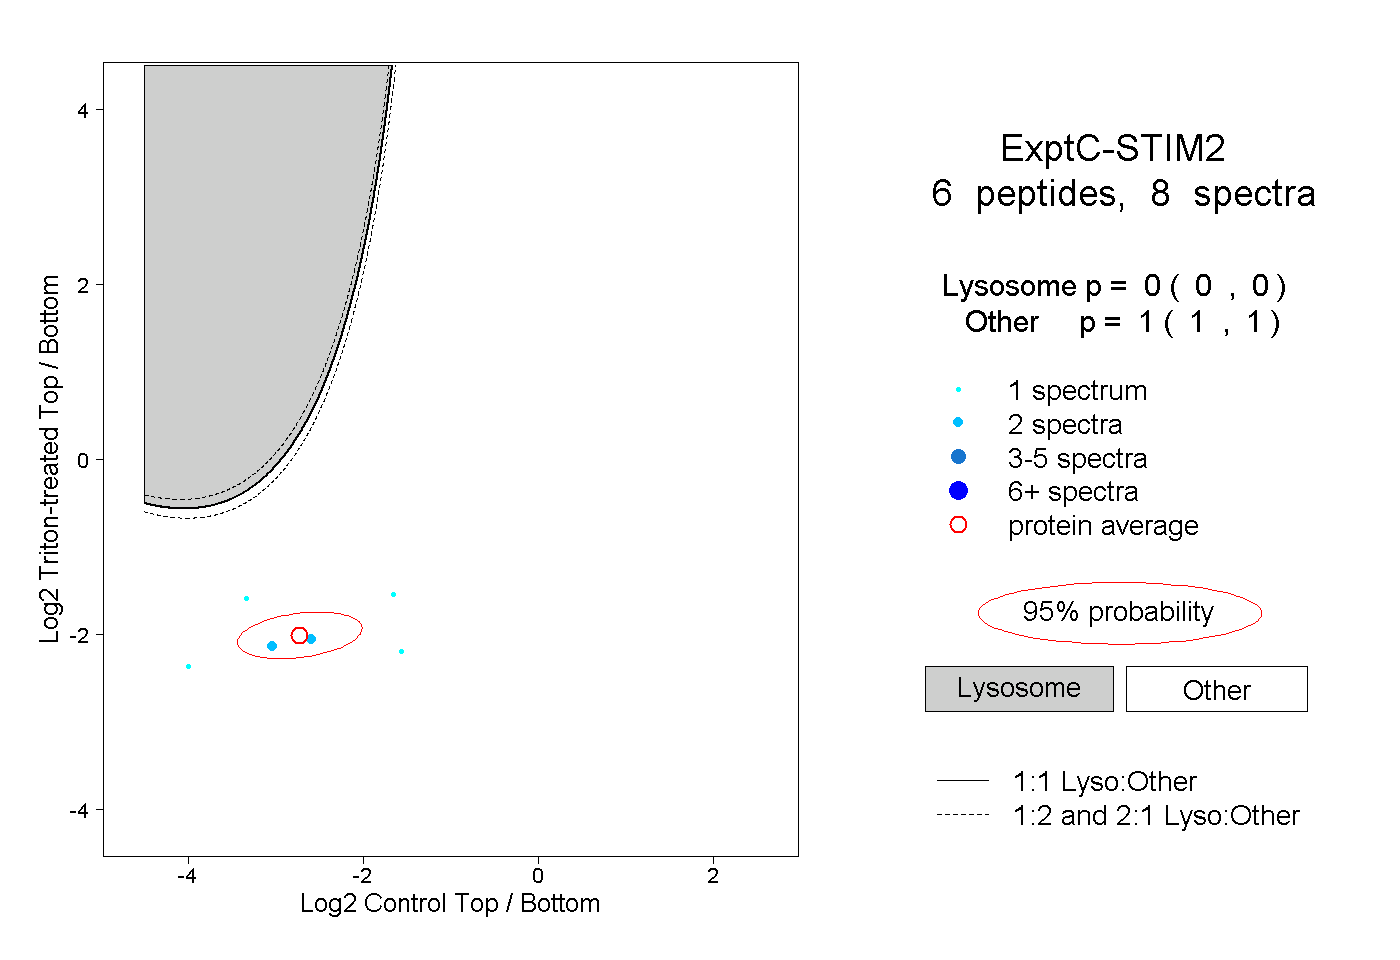
0.000 | 0.000
1.000 | 1.000