 8
8peptides
spectra
0.000 | 0.000
0.000 | 0.000
0.000 | 0.000
0.385 | 0.492
0.389 | 0.494
0.000 | 0.000
0.000 | 0.032
0.084 | 0.115
| Plot | Mito | Lyso | Perox | ER | Golgi | PM | Cytosol | Nucleus | |||||
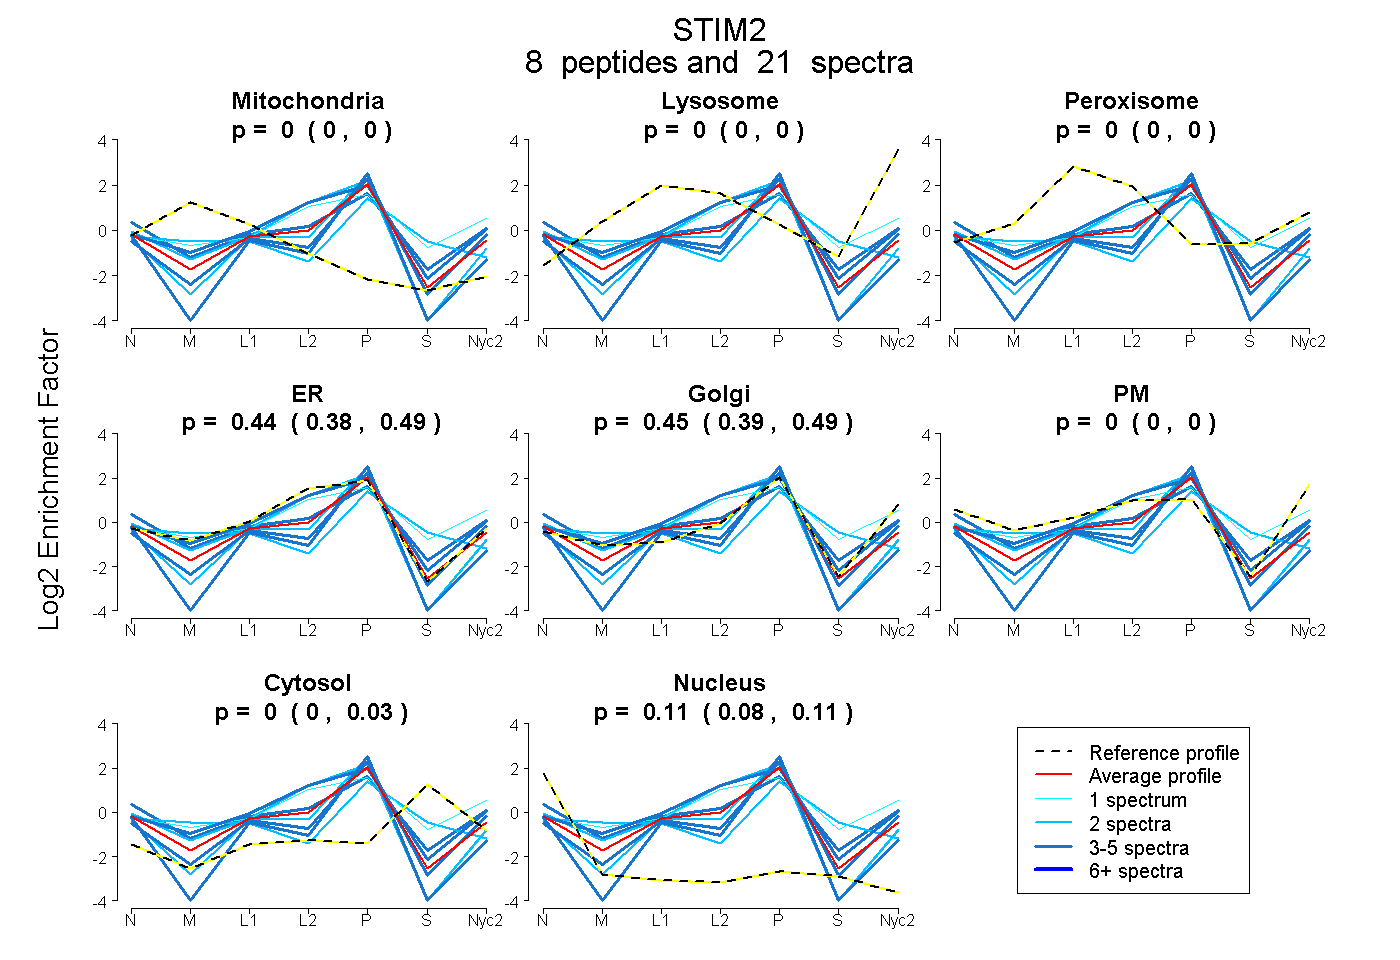
| Expt A |
8 peptides |
21 spectra |
|
0.000 0.000 | 0.000 |
0.000 0.000 | 0.000 |
0.000 0.000 | 0.000 |
0.441 0.385 | 0.492 |
0.453 0.389 | 0.494 |
0.000 0.000 | 0.000 |
0.000 0.000 | 0.032 |
0.106 0.084 | 0.115 |
| 4 spectra, QYAEQELEQVR | 0.000 | 0.000 | 0.031 | 0.728 | 0.196 | 0.014 | 0.030 | 0.000 | ||
| 2 spectra, GDSPVTADVSR | 0.187 | 0.000 | 0.000 | 0.000 | 0.503 | 0.000 | 0.310 | 0.000 | ||
| 4 spectra, AQLPAHAPLAAHPR | 0.000 | 0.000 | 0.057 | 0.281 | 0.415 | 0.114 | 0.076 | 0.057 | ||
| 1 spectrum, HITVEDLWK | 0.000 | 0.130 | 0.003 | 0.441 | 0.110 | 0.123 | 0.194 | 0.000 | ||
| 2 spectra, EGAECELSR | 0.000 | 0.000 | 0.000 | 0.935 | 0.000 | 0.000 | 0.000 | 0.065 | ||
| 3 spectra, SMIFSPASR | 0.000 | 0.000 | 0.000 | 0.089 | 0.806 | 0.000 | 0.000 | 0.105 | ||
| 2 spectra, DELSLEDSSR | 0.000 | 0.000 | 0.000 | 0.419 | 0.434 | 0.000 | 0.000 | 0.147 | ||
| 3 spectra, SIVPSSPQSQR | 0.000 | 0.000 | 0.000 | 0.239 | 0.513 | 0.000 | 0.000 | 0.248 |
| Plot | Mito | Lyso or Perox | ER | Golgi | PM | Cytosol | Nucleus | ||||||
| Expt B |
3 peptides |
3 spectra |
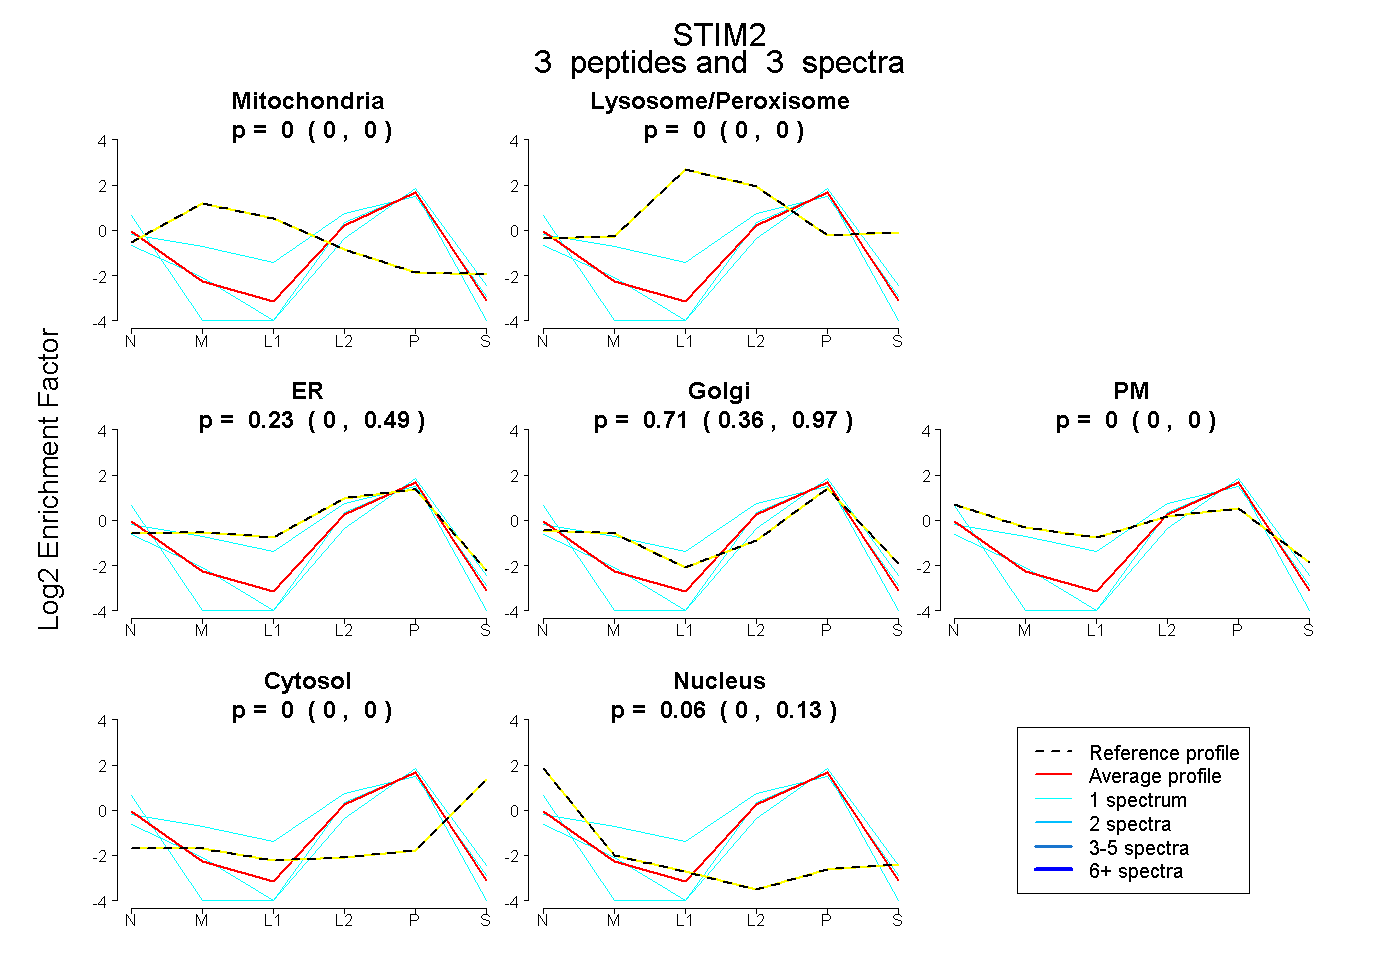 |
0.000 0.000 | 0.000 |
0.000 0.000 | 0.000 |
0.228 0.000 | 0.486 |
0.715 0.361 | 0.967 |
0.000 0.000 | 0.000 |
0.000 0.000 | 0.000 |
0.057 0.000 | 0.126 |
|||
| Plot | Lyso | Other | |||||||||||
| Expt C |
6 peptides |
8 spectra |
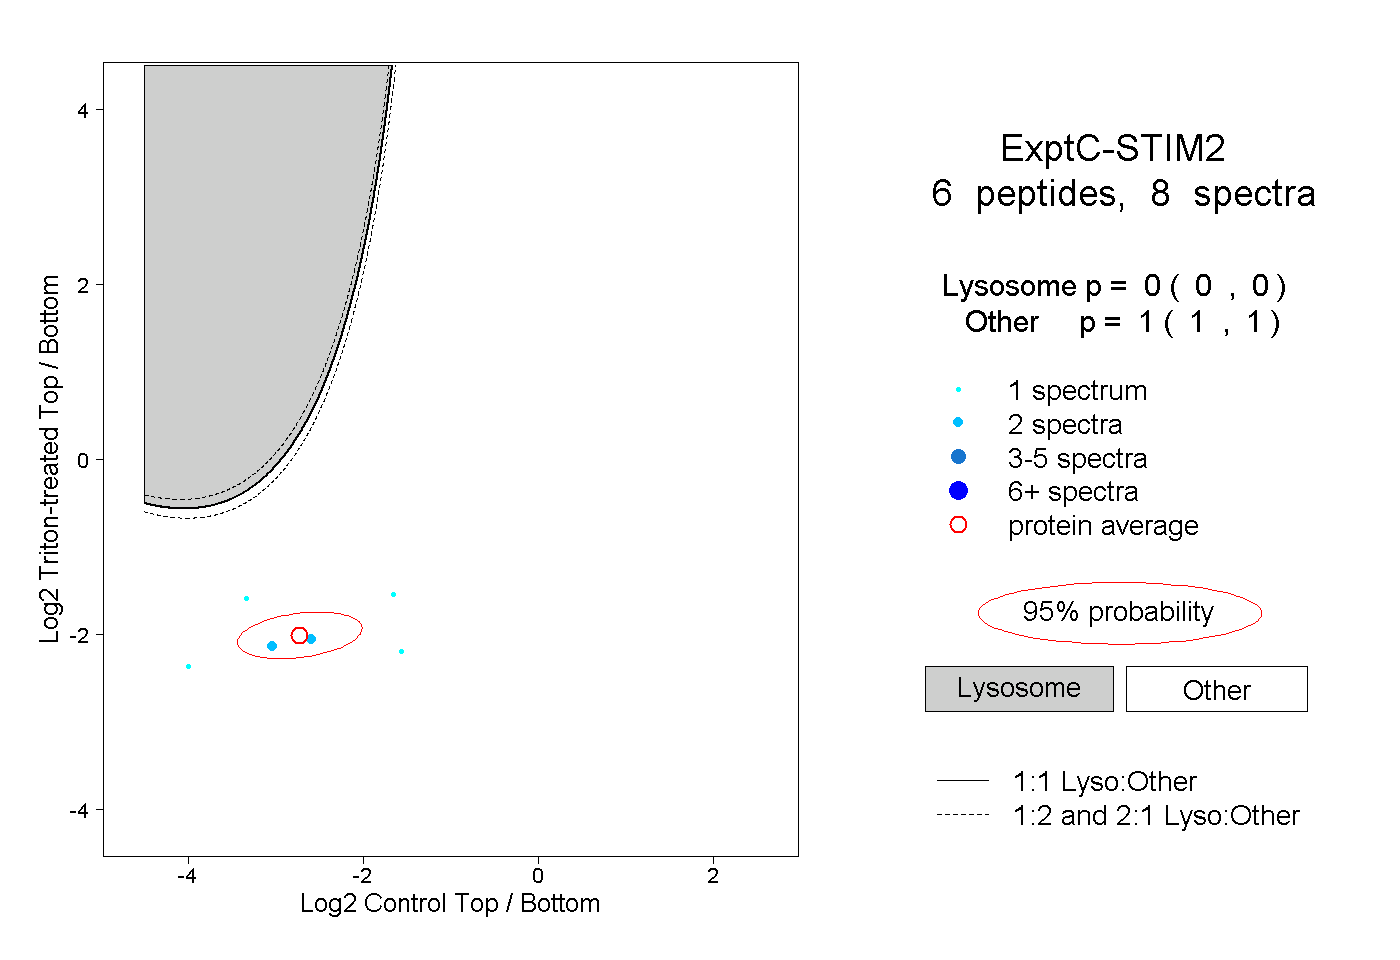 |
0.000 0.000 | 0.000 |
1.000 1.000 | 1.000 |