 3
3peptides
spectra
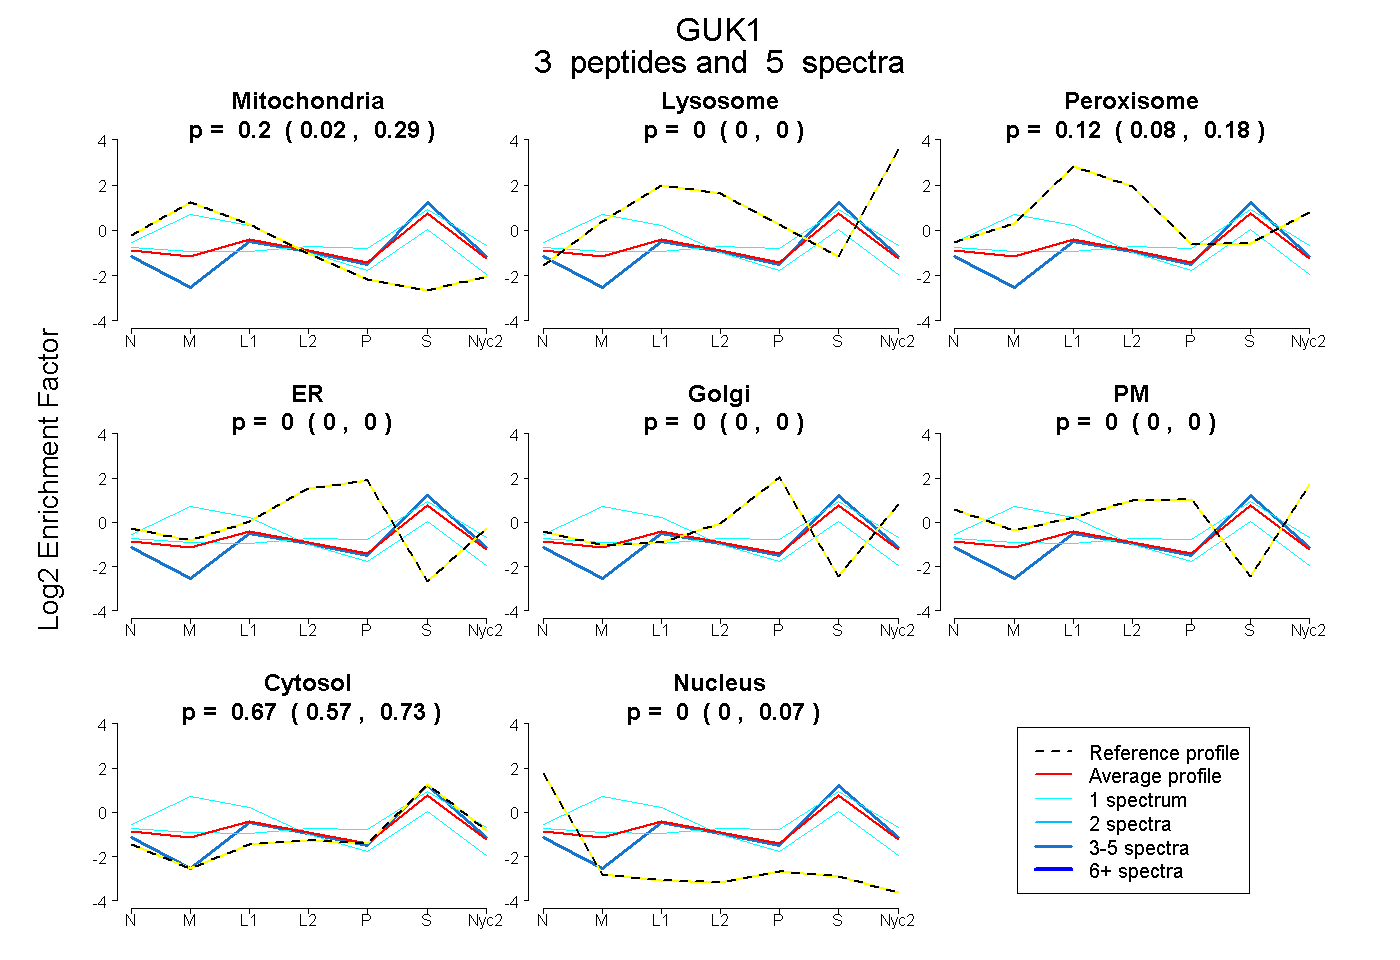
0.023 | 0.286
0.000 | 0.000
0.080 | 0.178
0.000 | 0.000
0.000 | 0.000
0.000 | 0.000
0.574 | 0.735
0.000 | 0.070
1peptide
spectrum
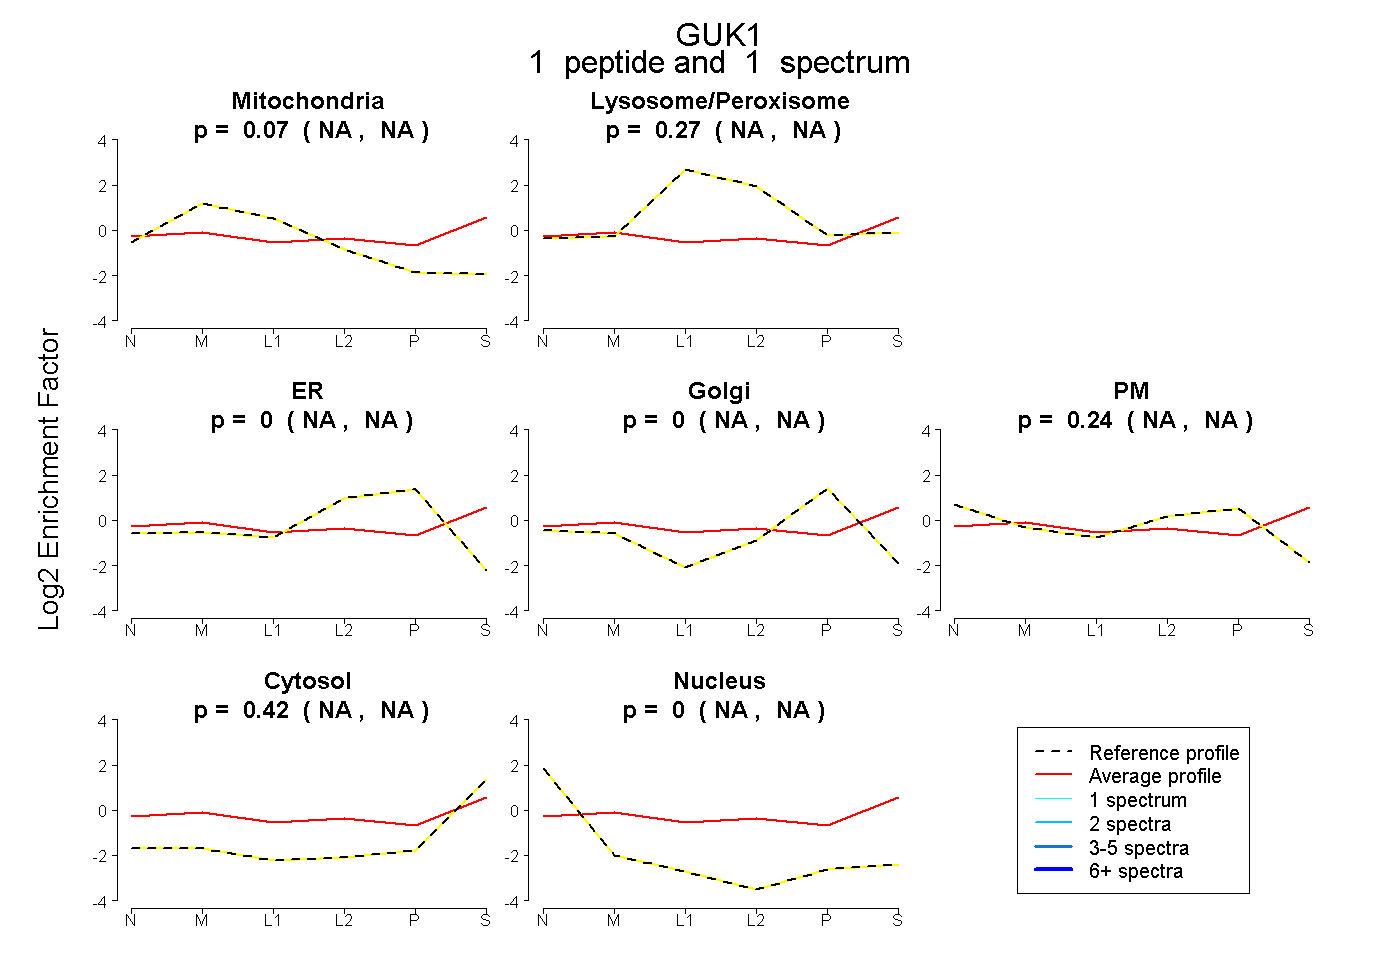
NA | NA
NA | NA
NA | NA
NA | NA
NA | NA
NA | NA
NA | NA
5peptides
spectra
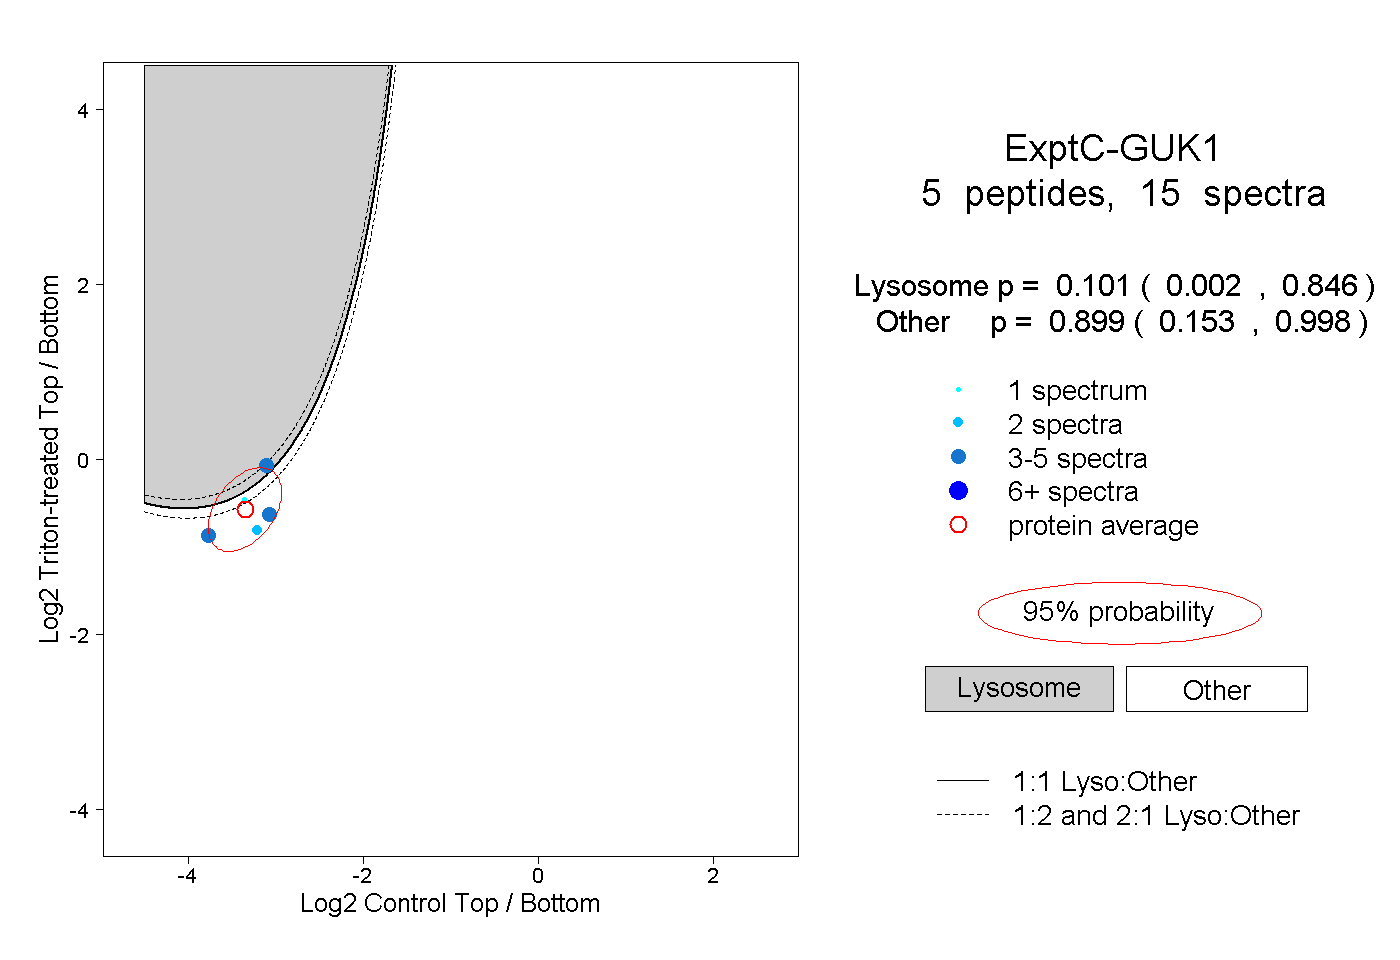
0.002 | 0.846
0.153 | 0.998
1peptide
spectrum
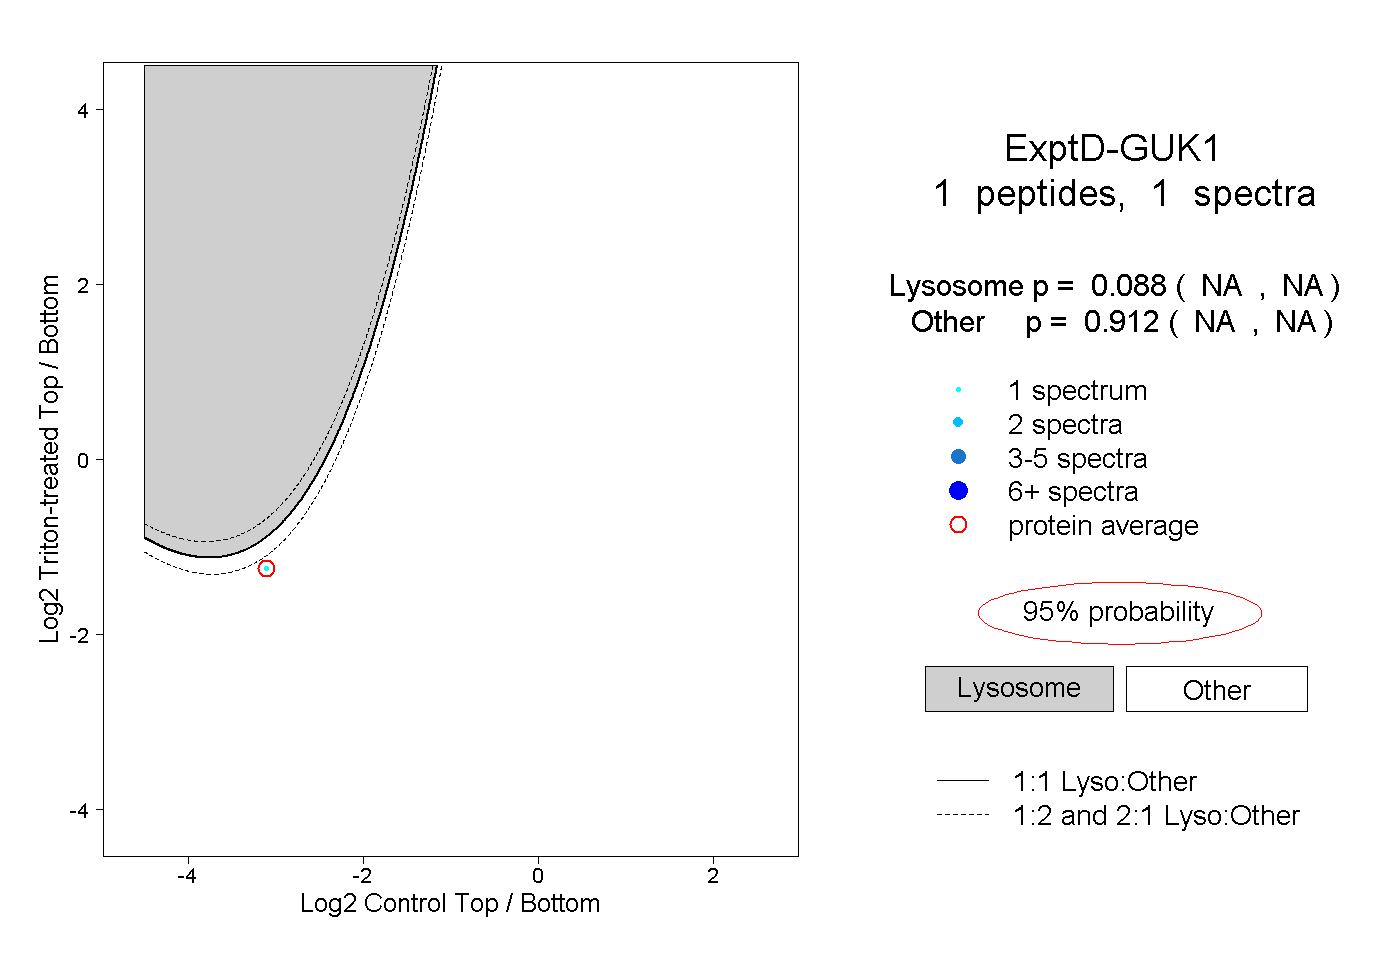
NA | NA
NA | NA