 3
3peptides
spectra
0.023 | 0.286
0.000 | 0.000
0.080 | 0.178
0.000 | 0.000
0.000 | 0.000
0.000 | 0.000
0.574 | 0.735
0.000 | 0.070
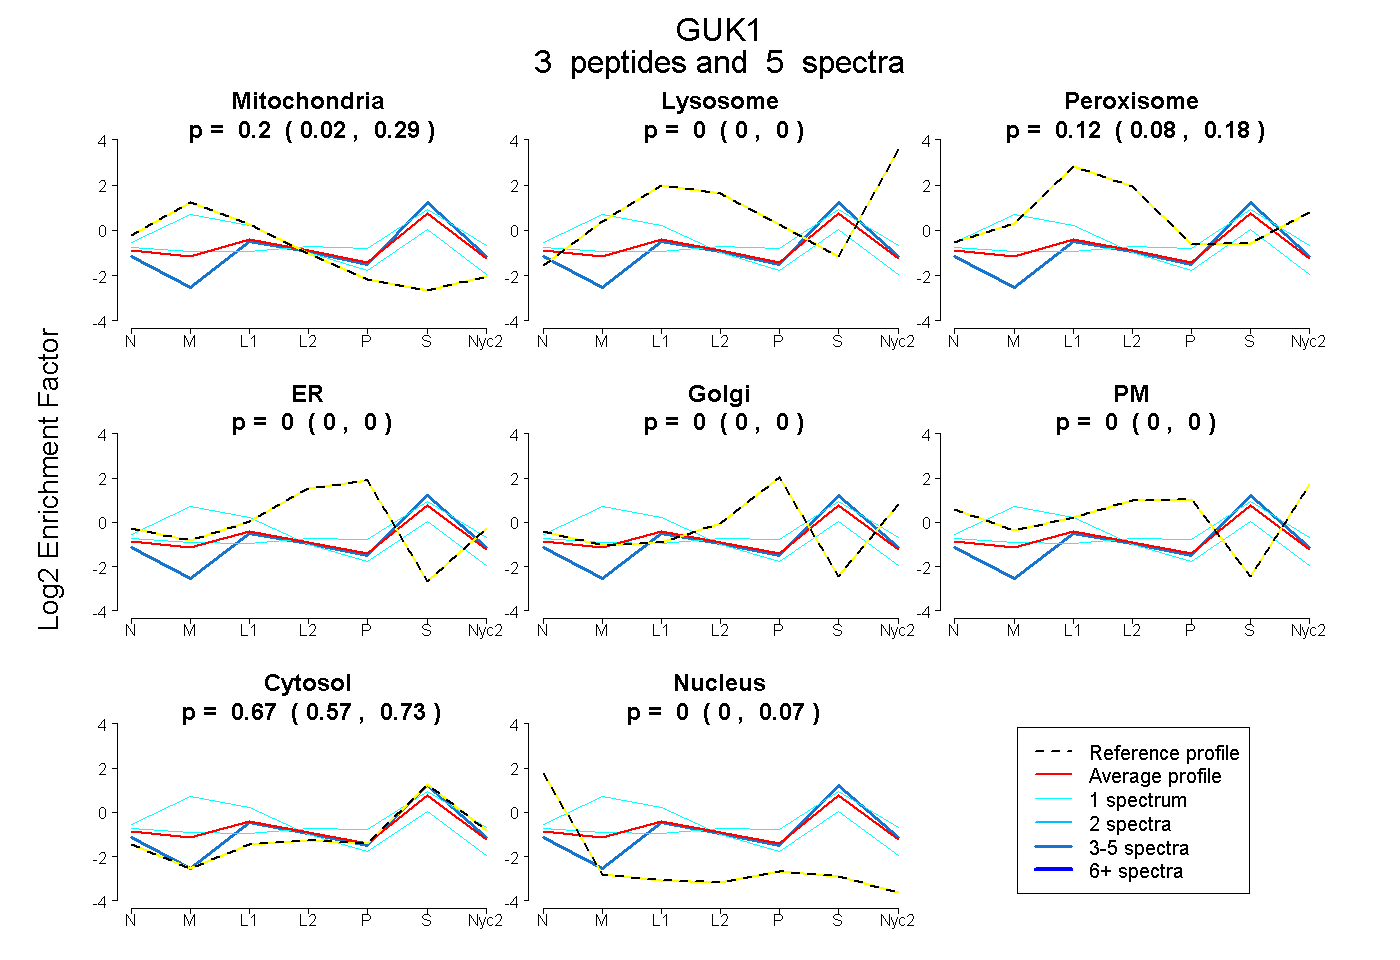
| Plot | Mito | Lyso | Perox | ER | Golgi | PM | Cytosol | Nucleus | |||||
| Expt A |
3 peptides |
5 spectra |
|
0.204 0.023 | 0.286 |
0.000 0.000 | 0.000 |
0.122 0.080 | 0.178 |
0.000 0.000 | 0.000 |
0.000 0.000 | 0.000 |
0.000 0.000 | 0.000 |
0.675 0.574 | 0.735 |
0.000 0.000 | 0.070 |
| 1 spectrum, QALSEEIK | 0.561 | 0.000 | 0.099 | 0.000 | 0.000 | 0.000 | 0.340 | 0.000 | ||
| 1 spectrum, NTETEESLAK | 0.104 | 0.000 | 0.124 | 0.000 | 0.034 | 0.049 | 0.689 | 0.000 | ||
| 3 spectra, AVQAMNR | 0.000 | 0.000 | 0.116 | 0.000 | 0.000 | 0.000 | 0.865 | 0.020 |
| Plot | Mito | Lyso or Perox | ER | Golgi | PM | Cytosol | Nucleus | ||||||
| Expt B |
1 peptide |
1 spectrum |
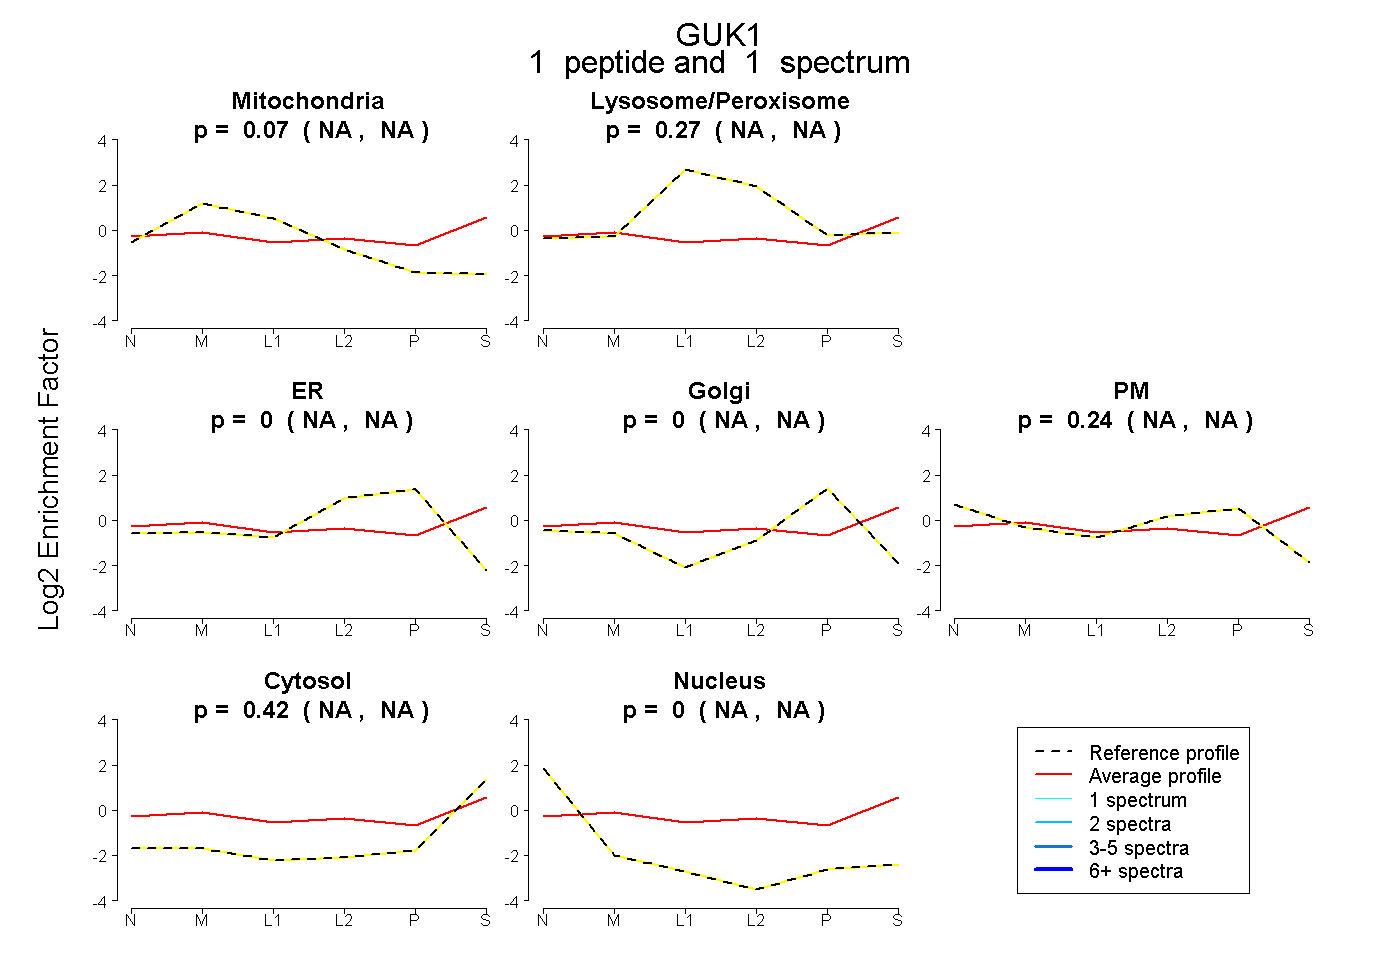 |
0.070 NA | NA |
0.268 NA | NA |
0.000 NA | NA |
0.000 NA | NA |
0.240 NA | NA |
0.422 NA | NA |
0.000 NA | NA |
|||
| Plot | Lyso | Other | |||||||||||
| Expt C |
5 peptides |
15 spectra |
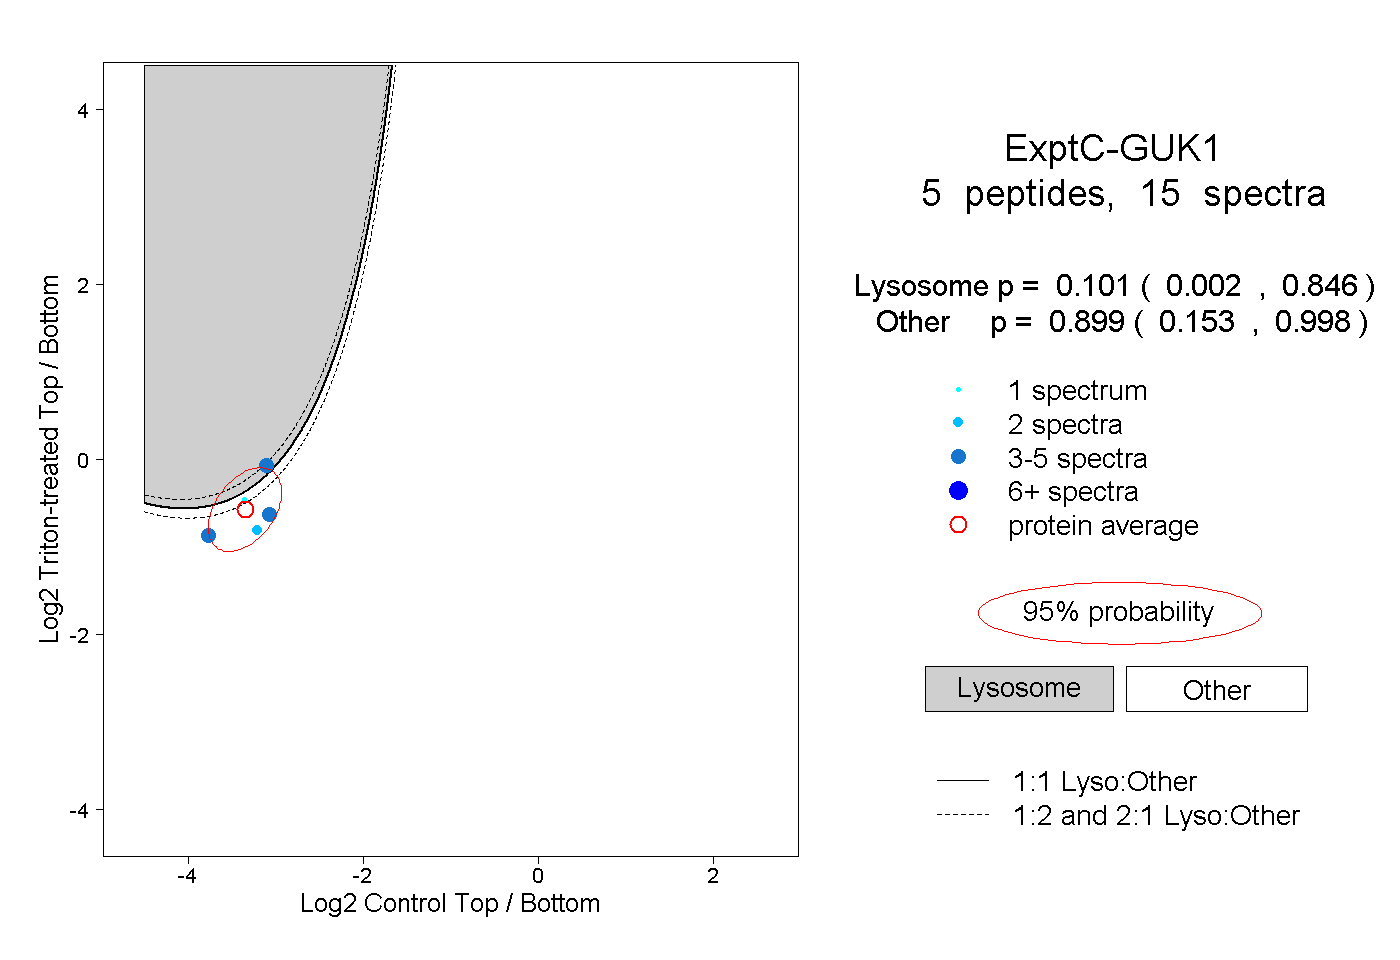 |
0.101 0.002 | 0.846 |
0.899 0.153 | 0.998 |
||||||||
| Plot | Lyso | Other | |||||||||||
| Expt D |
1 peptide |
1 spectrum |
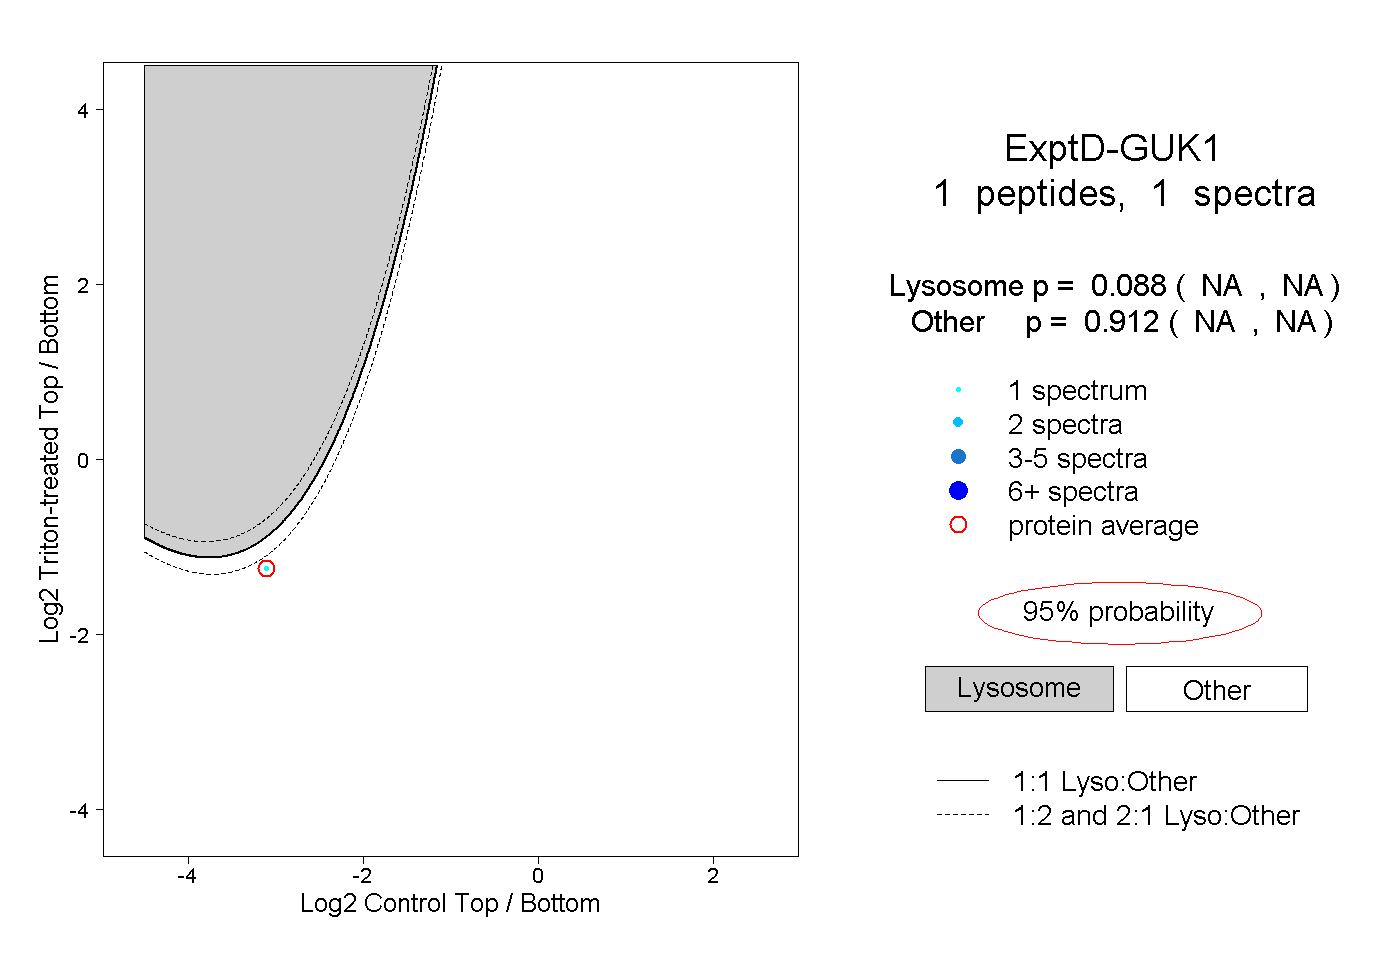 |
0.088 NA | NA |
0.912 NA | NA |