 4
4peptides
spectra
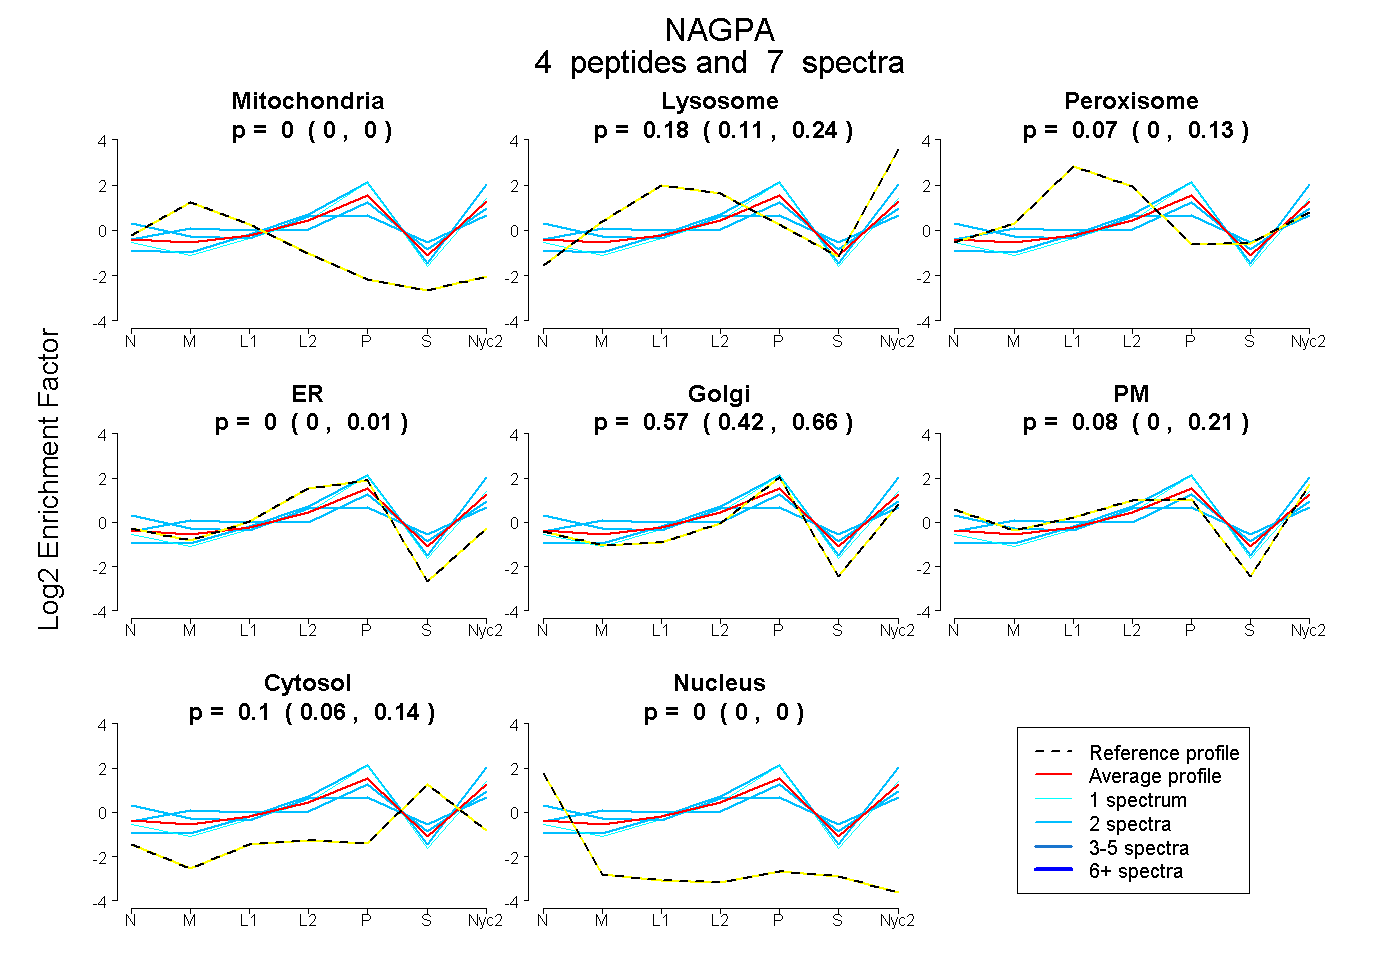
0.000 | 0.000
0.107 | 0.242
0.000 | 0.126
0.000 | 0.008
0.416 | 0.660
0.000 | 0.207
0.059 | 0.143
0.000 | 0.000
1peptide
spectrum
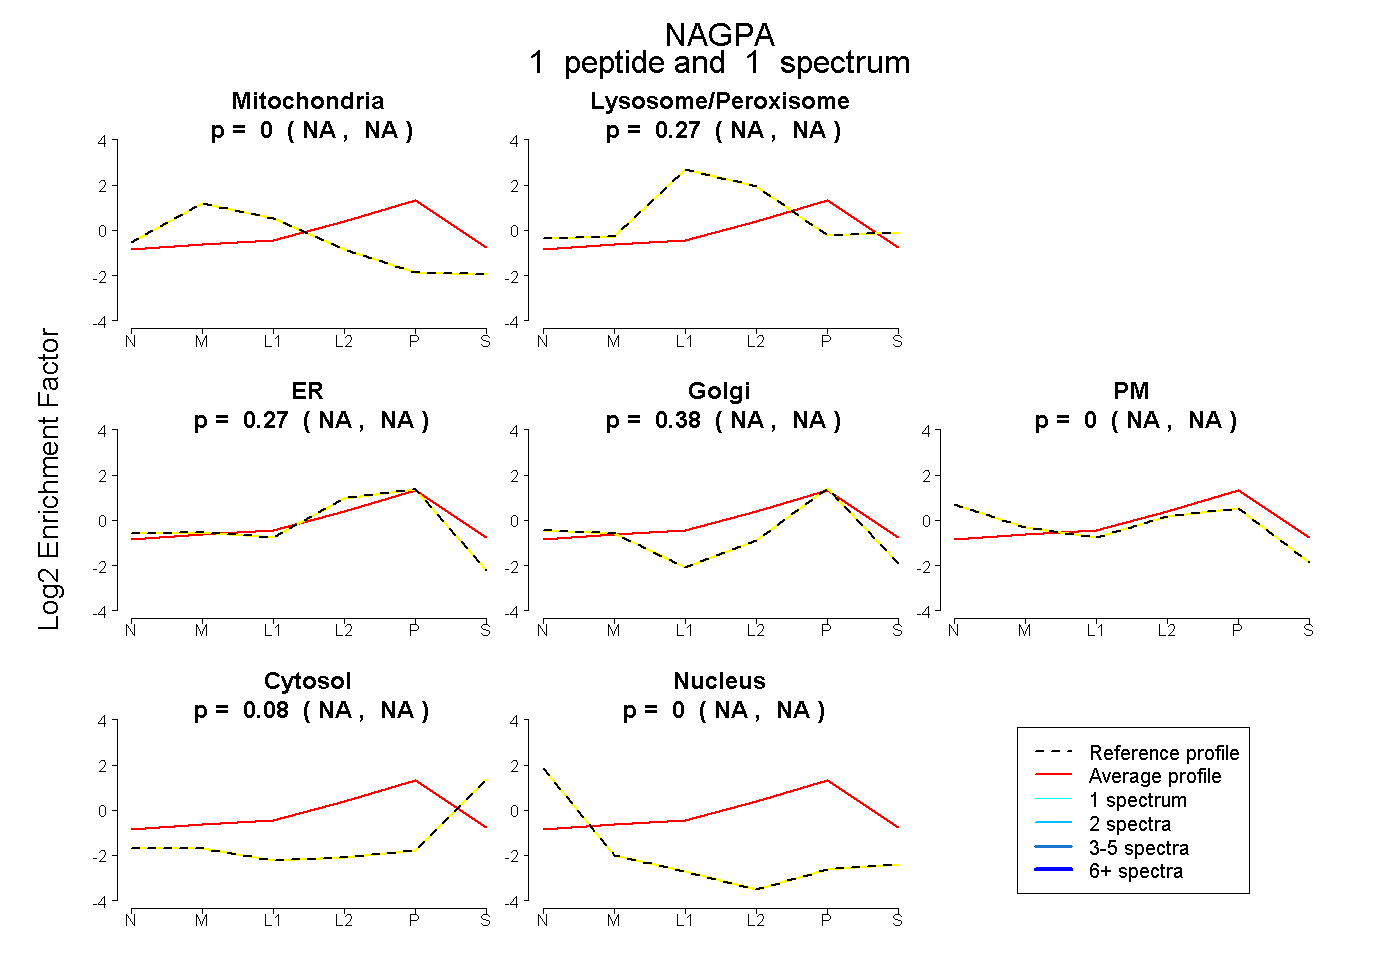
NA | NA
NA | NA
NA | NA
NA | NA
NA | NA
NA | NA
NA | NA
5peptides
spectra
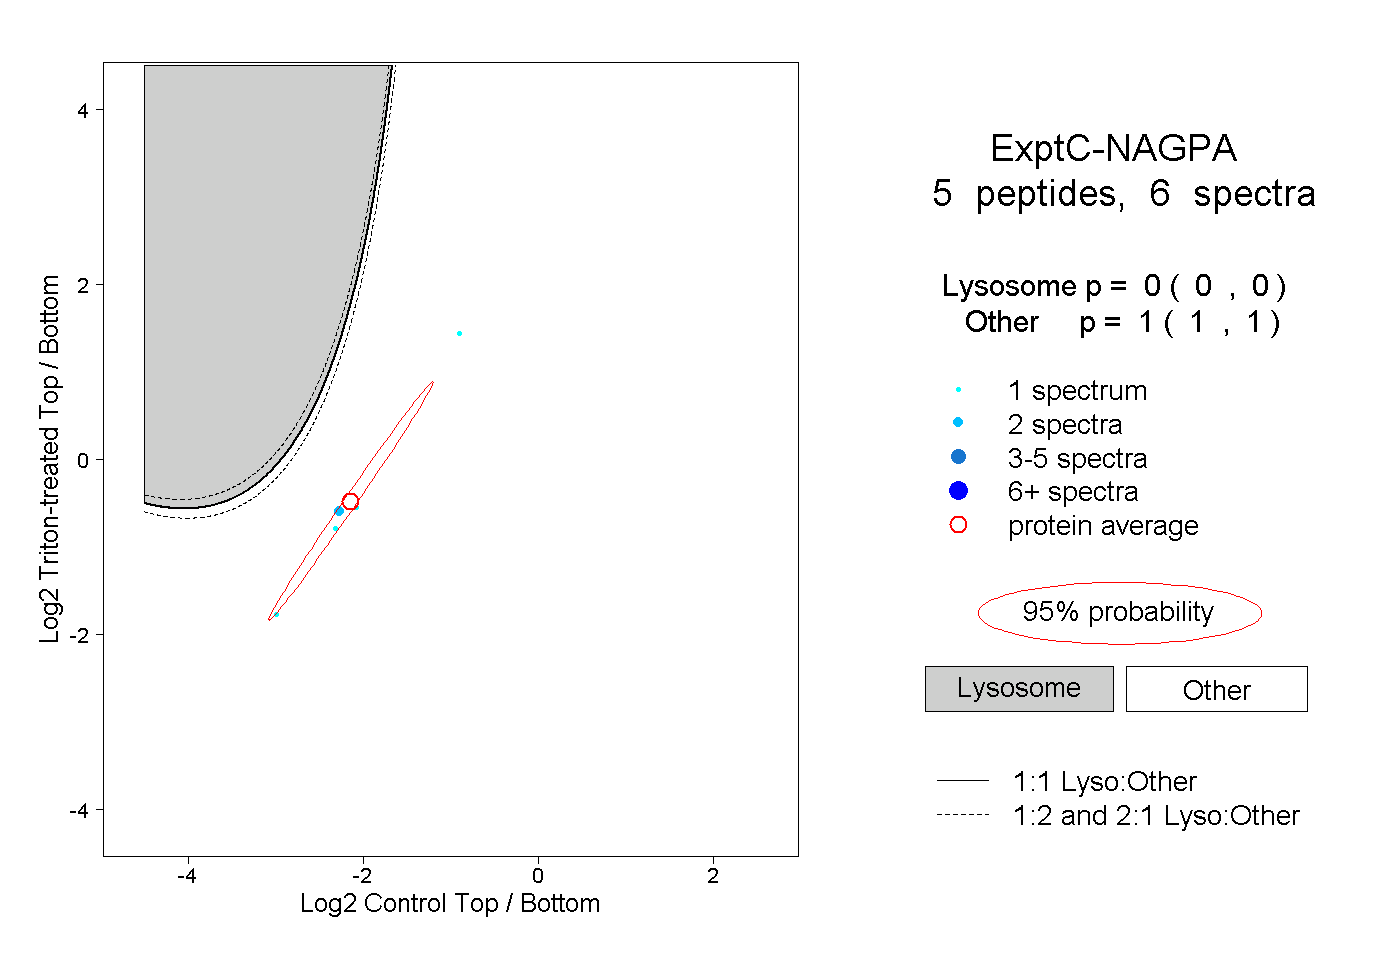
0.000 | 0.000
1.000 | 1.000
1peptide
spectrum
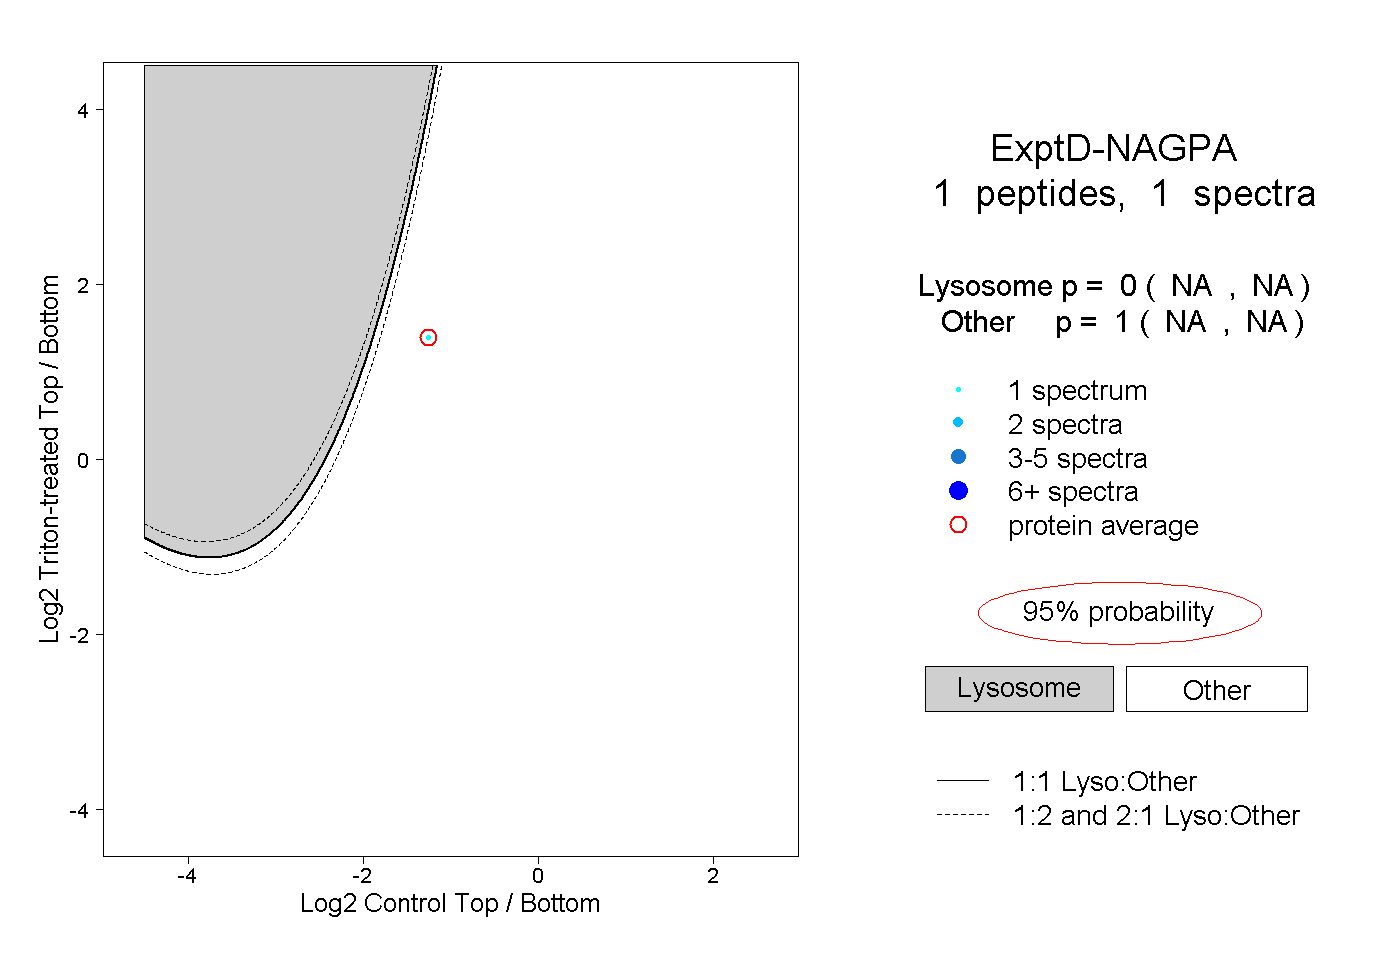
NA | NA
NA | NA