 4
4peptides
spectra
0.000 | 0.000
0.107 | 0.242
0.000 | 0.126
0.000 | 0.008
0.416 | 0.660
0.000 | 0.207
0.059 | 0.143
0.000 | 0.000
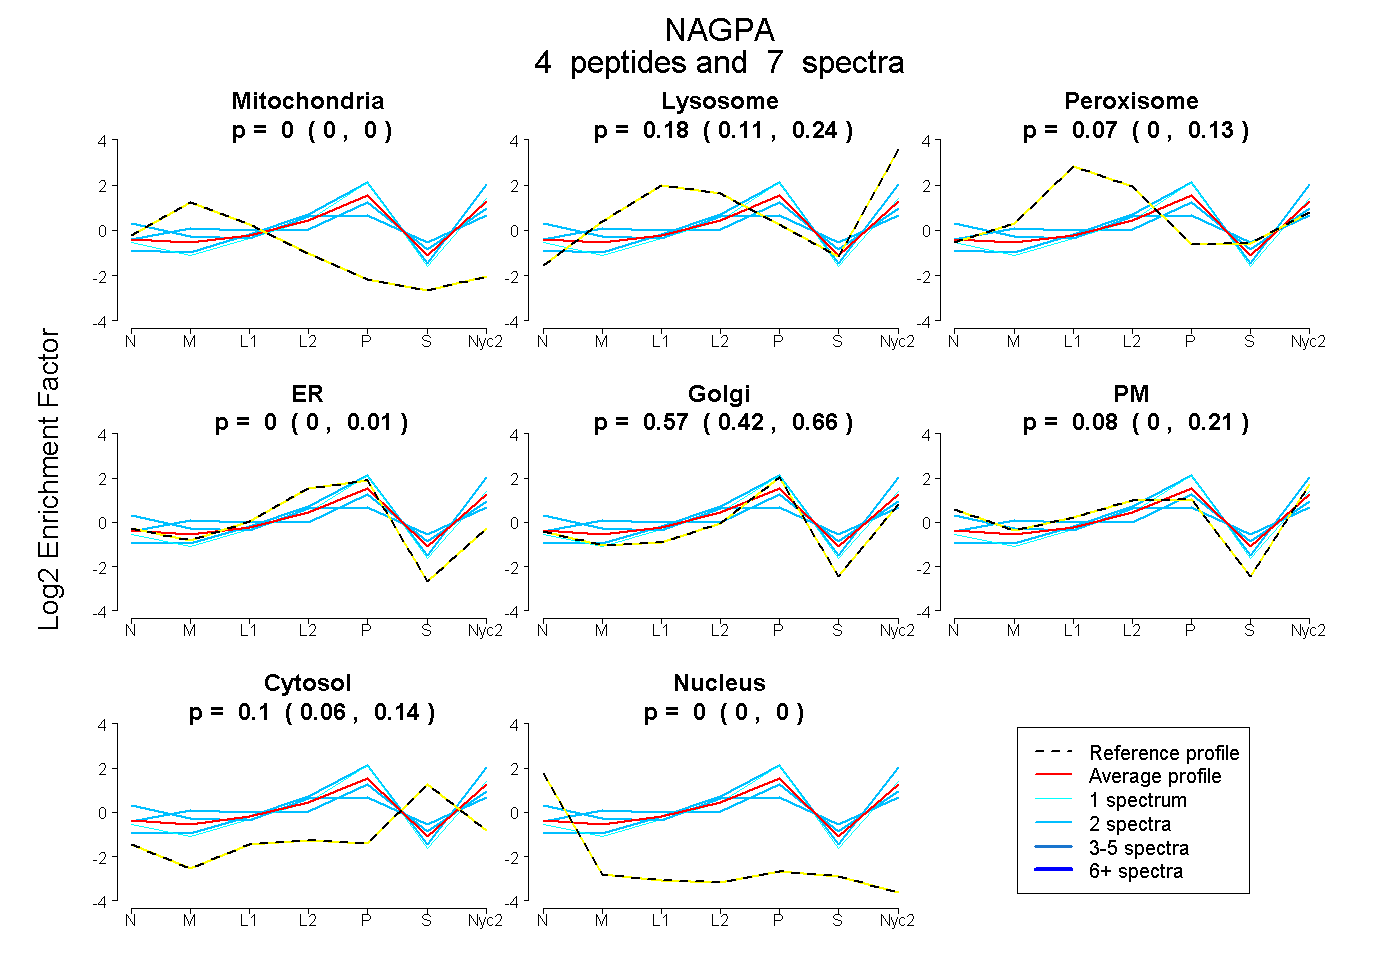
| Plot | Mito | Lyso | Perox | ER | Golgi | PM | Cytosol | Nucleus | |||||
| Expt A |
4 peptides |
7 spectra |
|
0.000 0.000 | 0.000 |
0.181 0.107 | 0.242 |
0.071 0.000 | 0.126 |
0.000 0.000 | 0.008 |
0.572 0.416 | 0.660 |
0.076 0.000 | 0.207 |
0.100 0.059 | 0.143 |
0.000 0.000 | 0.000 |
| 2 spectra, TAVGHDR | 0.000 | 0.000 | 0.098 | 0.051 | 0.000 | 0.575 | 0.276 | 0.000 | ||
| 2 spectra, FVNVMSAR | 0.000 | 0.312 | 0.000 | 0.000 | 0.688 | 0.000 | 0.000 | 0.000 | ||
| 2 spectra, AVAGHLTR | 0.039 | 0.154 | 0.156 | 0.000 | 0.541 | 0.000 | 0.109 | 0.000 | ||
| 1 spectrum, MGTGECLGNVVSDGR | 0.000 | 0.188 | 0.000 | 0.005 | 0.783 | 0.000 | 0.024 | 0.000 |
| Plot | Mito | Lyso or Perox | ER | Golgi | PM | Cytosol | Nucleus | ||||||
| Expt B |
1 peptide |
1 spectrum |
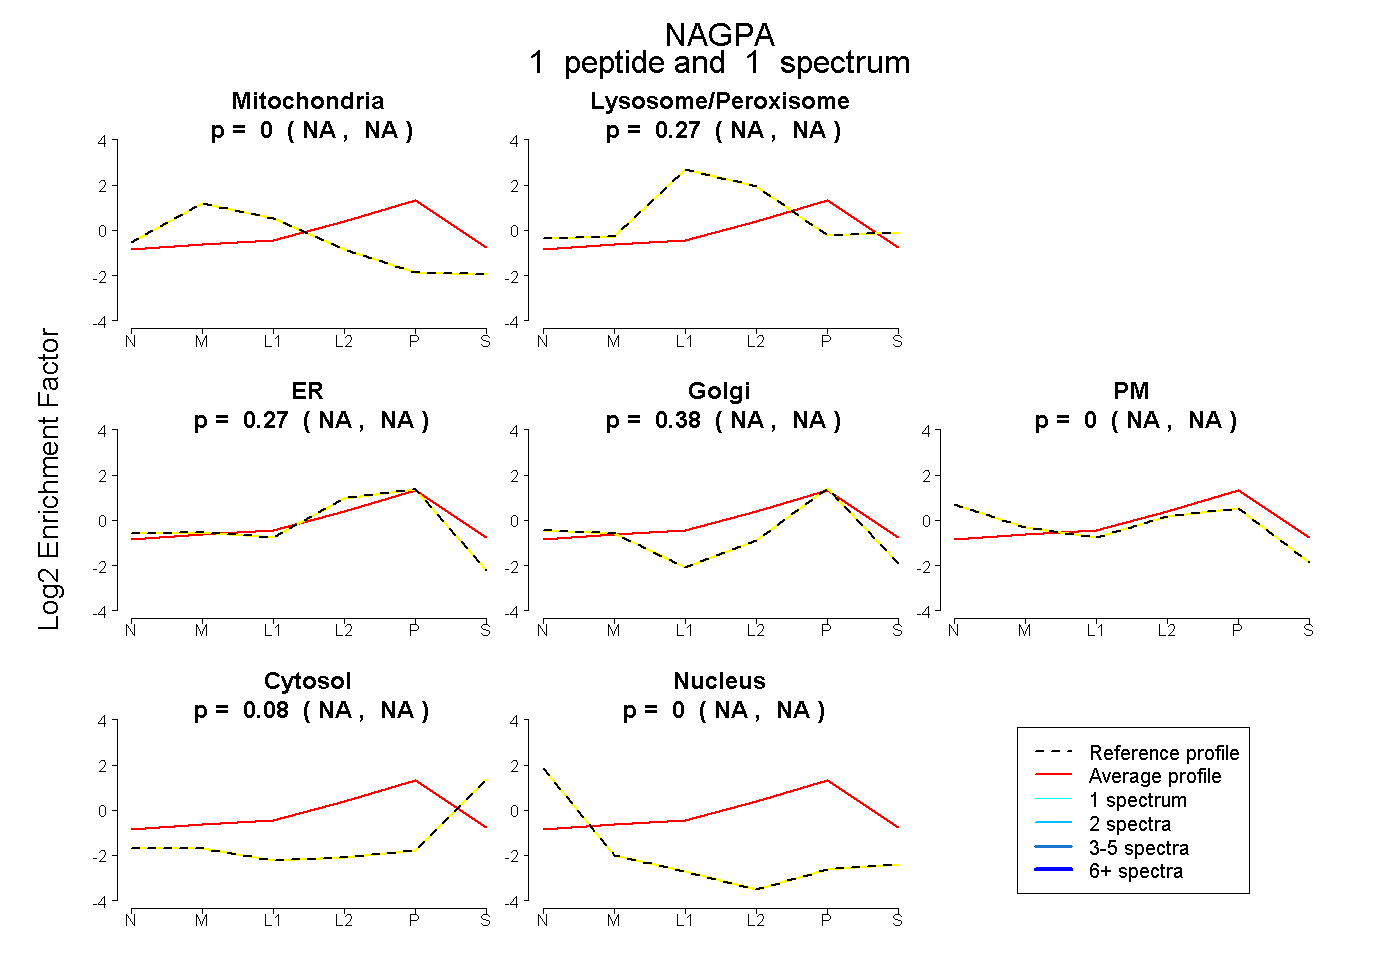 |
0.000 NA | NA |
0.273 NA | NA |
0.268 NA | NA |
0.382 NA | NA |
0.000 NA | NA |
0.077 NA | NA |
0.000 NA | NA |
|||
| Plot | Lyso | Other | |||||||||||
| Expt C |
5 peptides |
6 spectra |
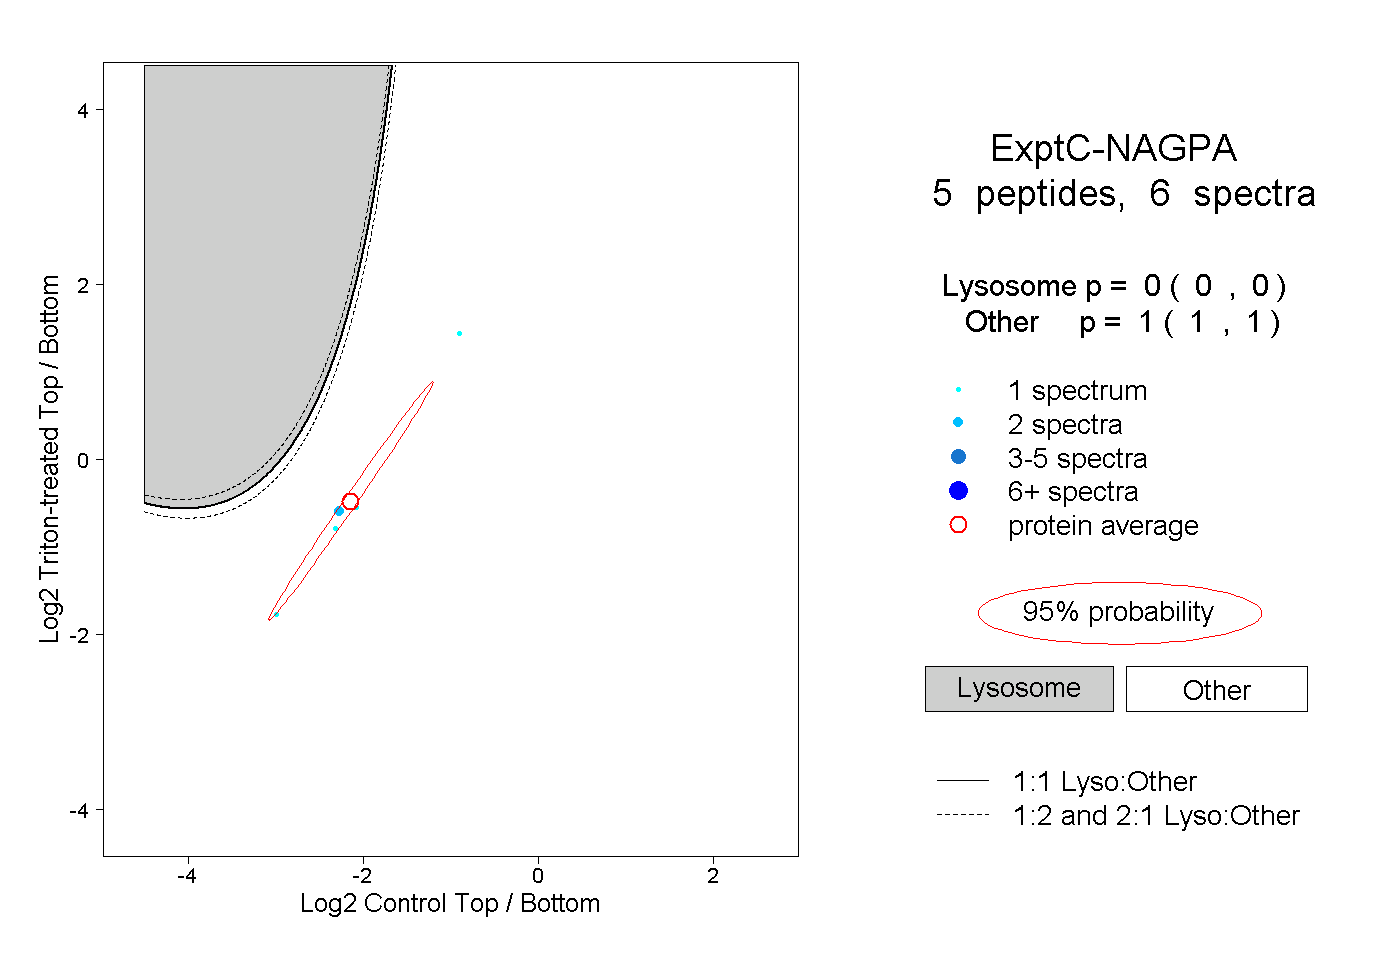 |
0.000 0.000 | 0.000 |
1.000 1.000 | 1.000 |
||||||||
| Plot | Lyso | Other | |||||||||||
| Expt D |
1 peptide |
1 spectrum |
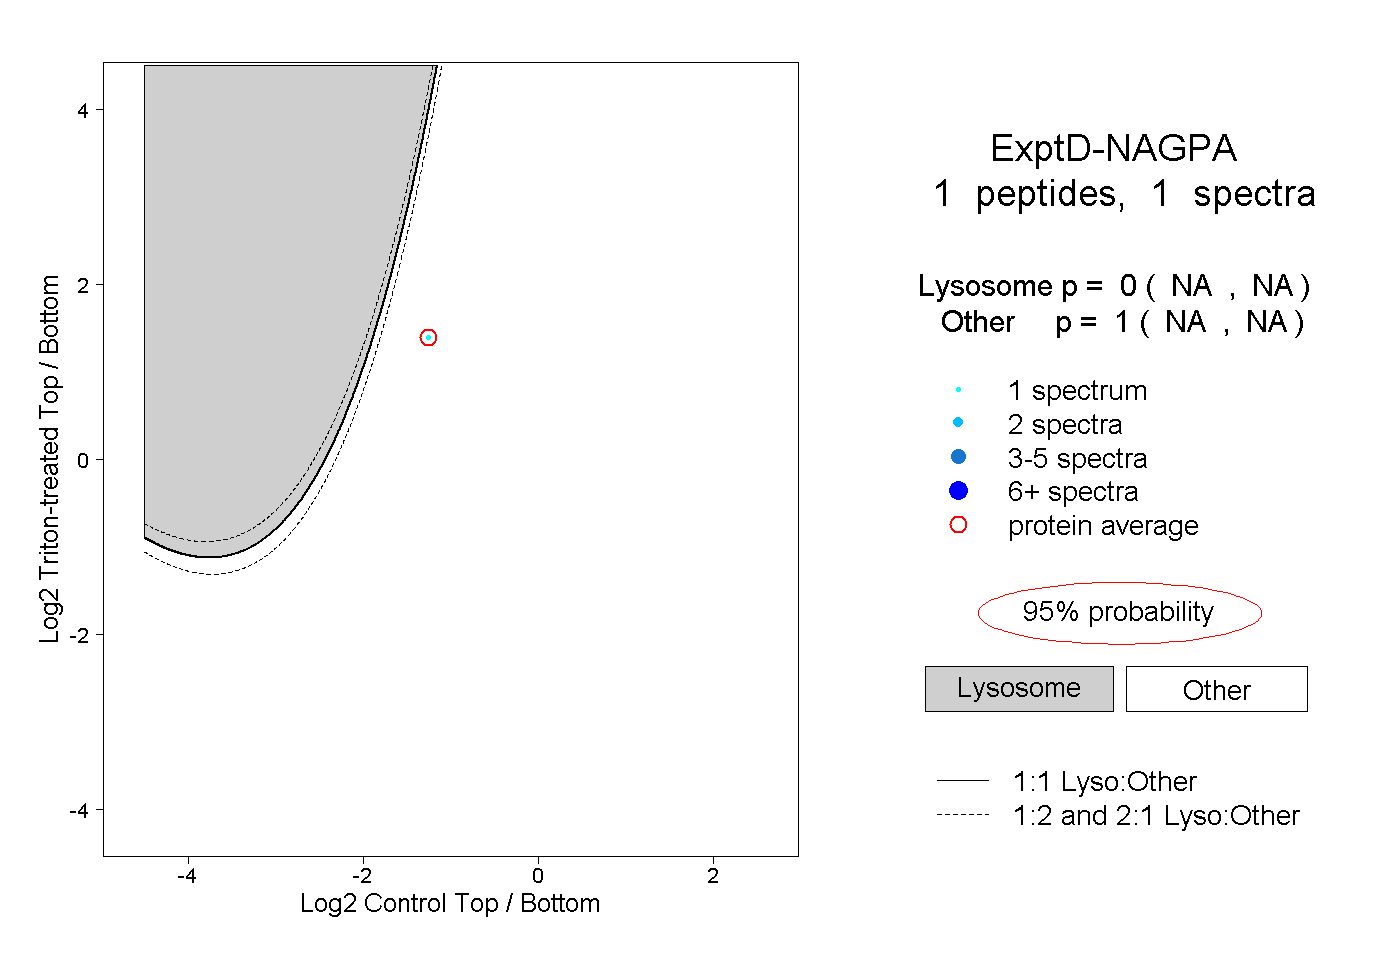 |
0.000 NA | NA |
1.000 NA | NA |