 4
4peptides
spectra
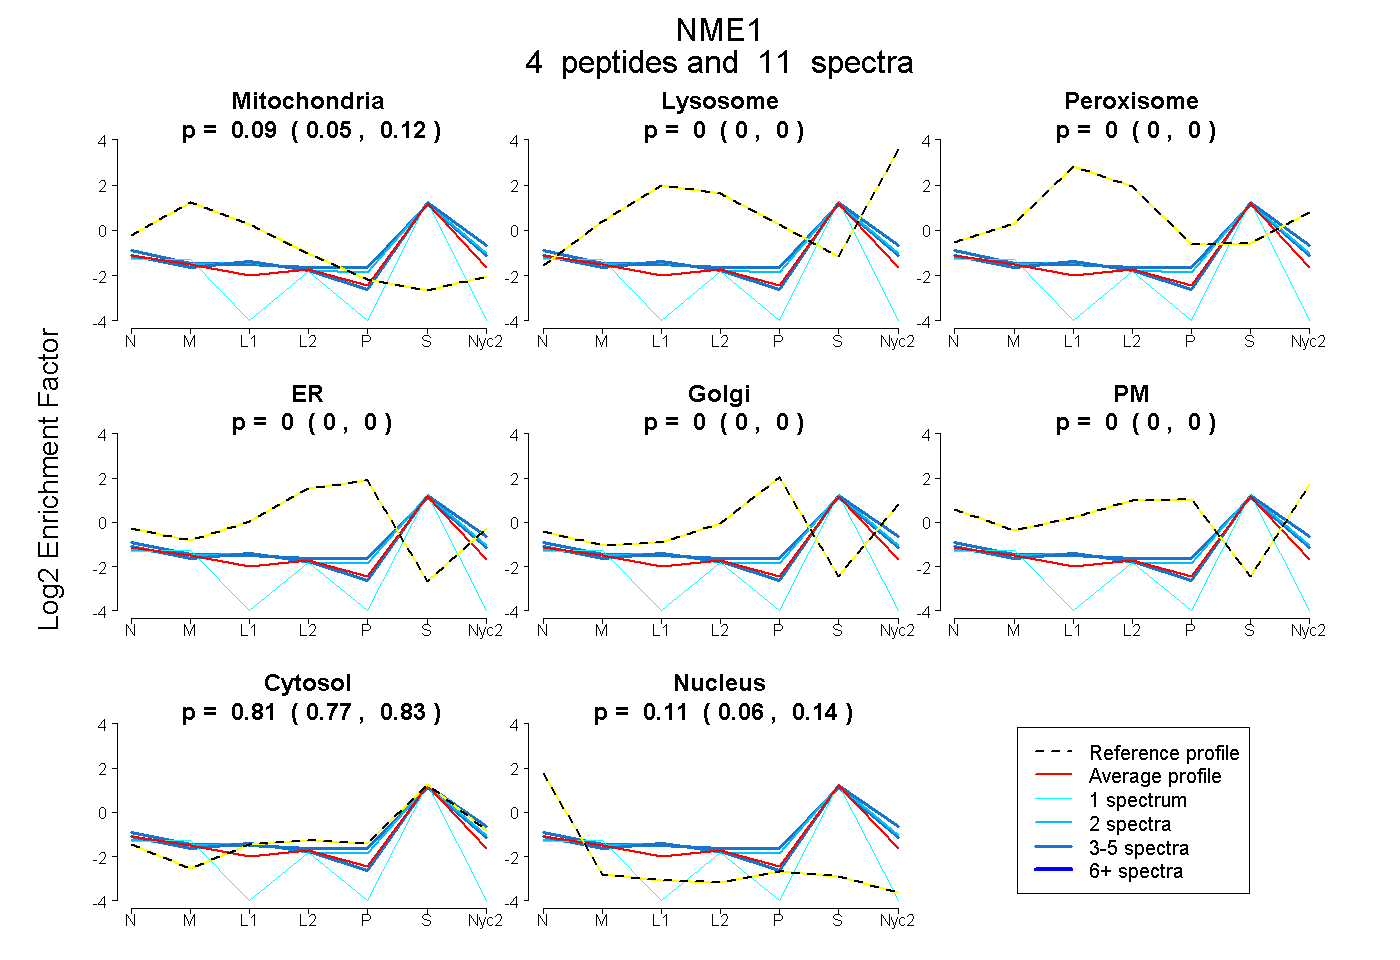
0.054 | 0.119
0.000 | 0.000
0.000 | 0.000
0.000 | 0.000
0.000 | 0.000
0.000 | 0.000
0.775 | 0.832
0.064 | 0.140
2peptides
spectra
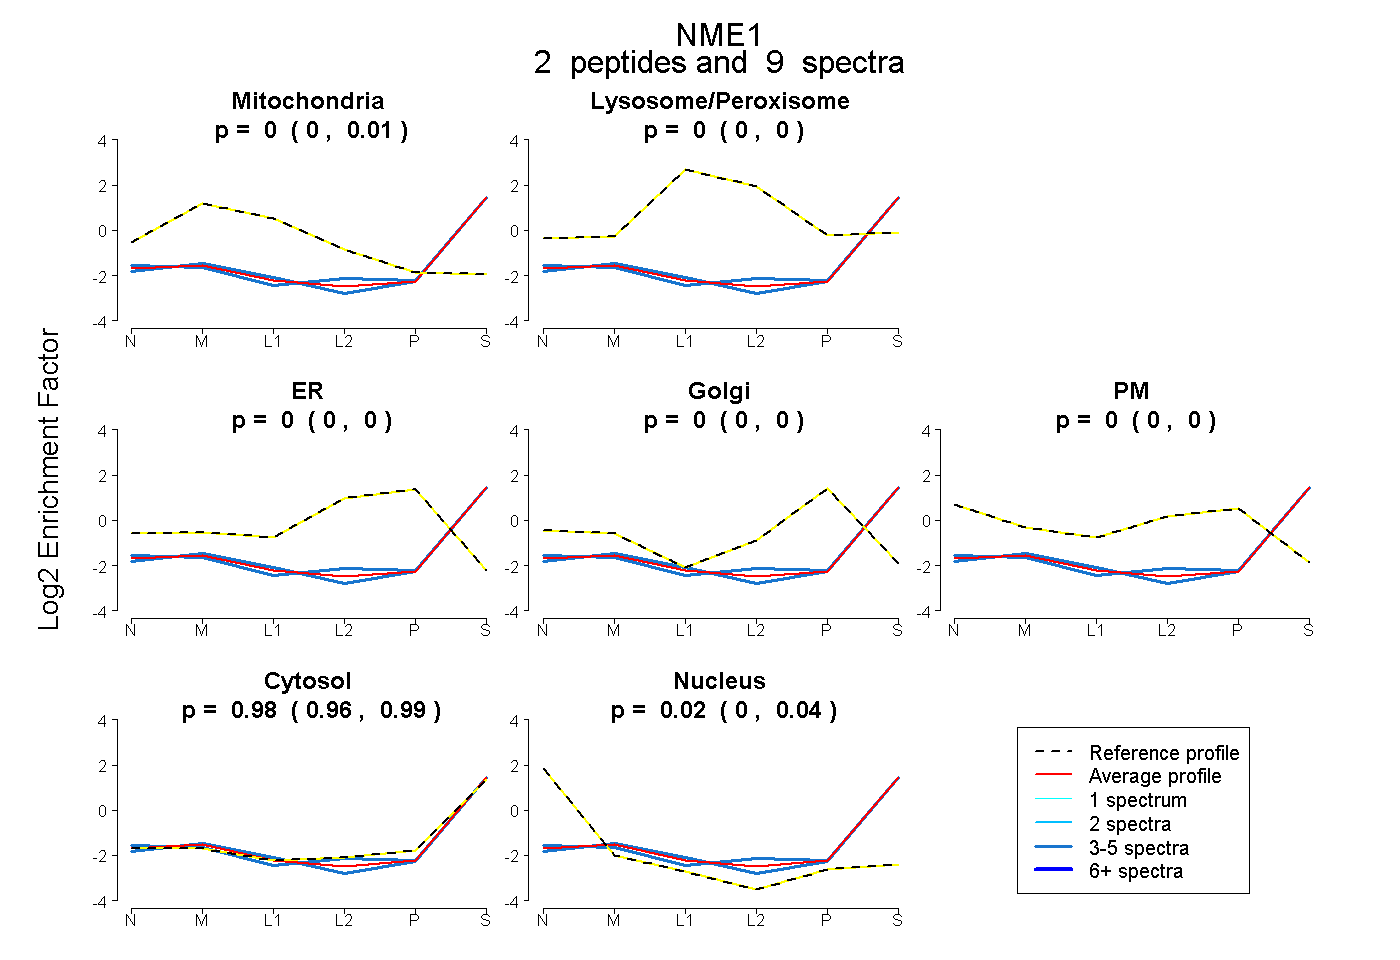
0.000 | 0.007
0.000 | 0.000
0.000 | 0.000
0.000 | 0.000
0.000 | 0.000
0.956 | 0.993
0.000 | 0.039
2peptides
spectra
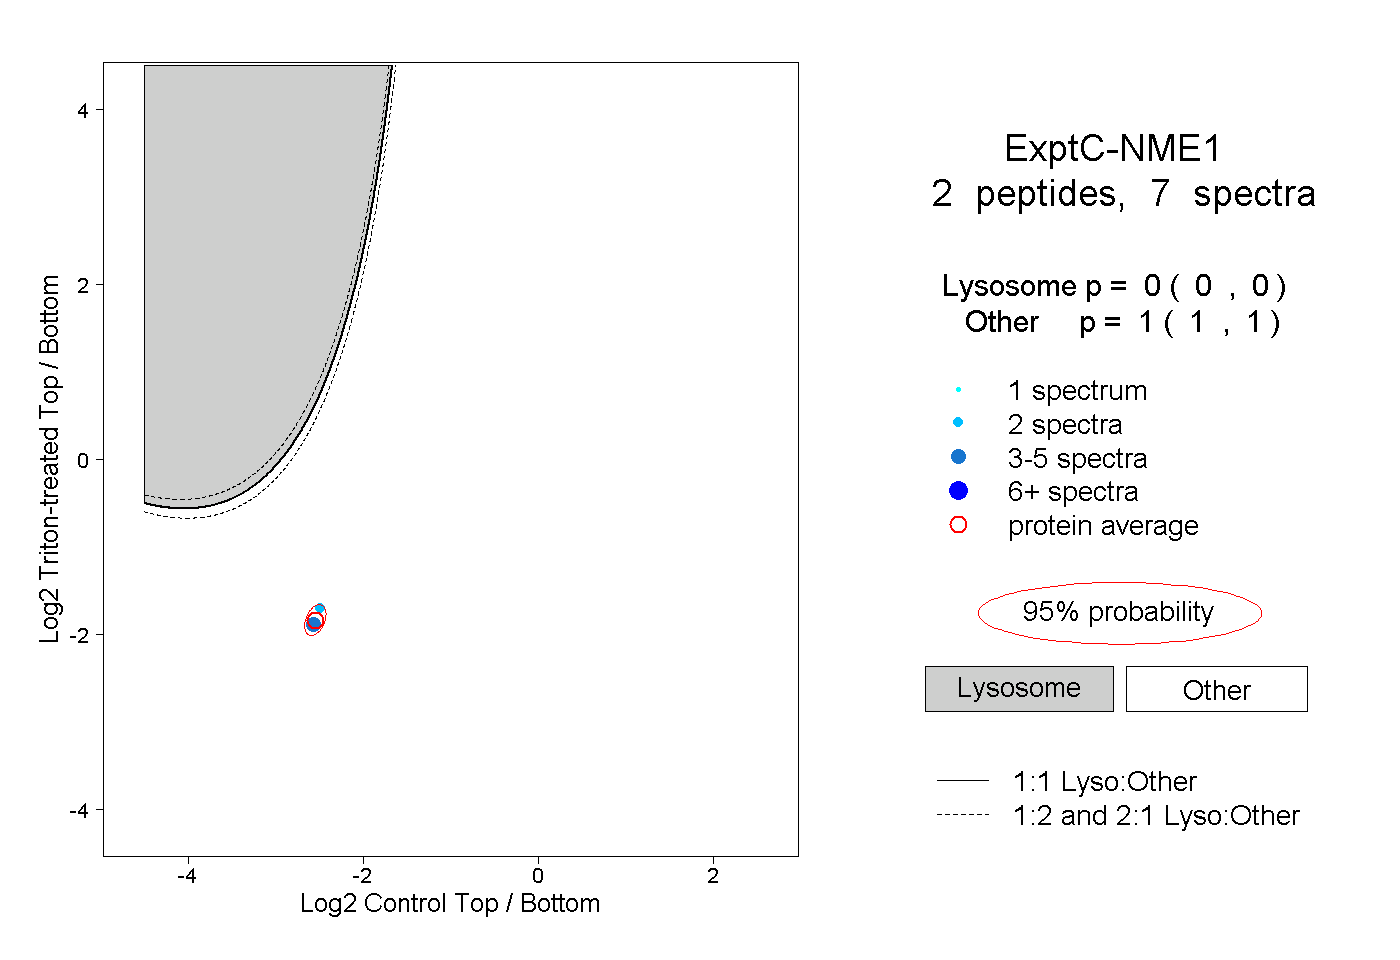
0.000 | 0.000
1.000 | 1.000