 4
4peptides
spectra
0.054 | 0.119
0.000 | 0.000
0.000 | 0.000
0.000 | 0.000
0.000 | 0.000
0.000 | 0.000
0.775 | 0.832
0.064 | 0.140
| Plot | Mito | Lyso | Perox | ER | Golgi | PM | Cytosol | Nucleus | |||||
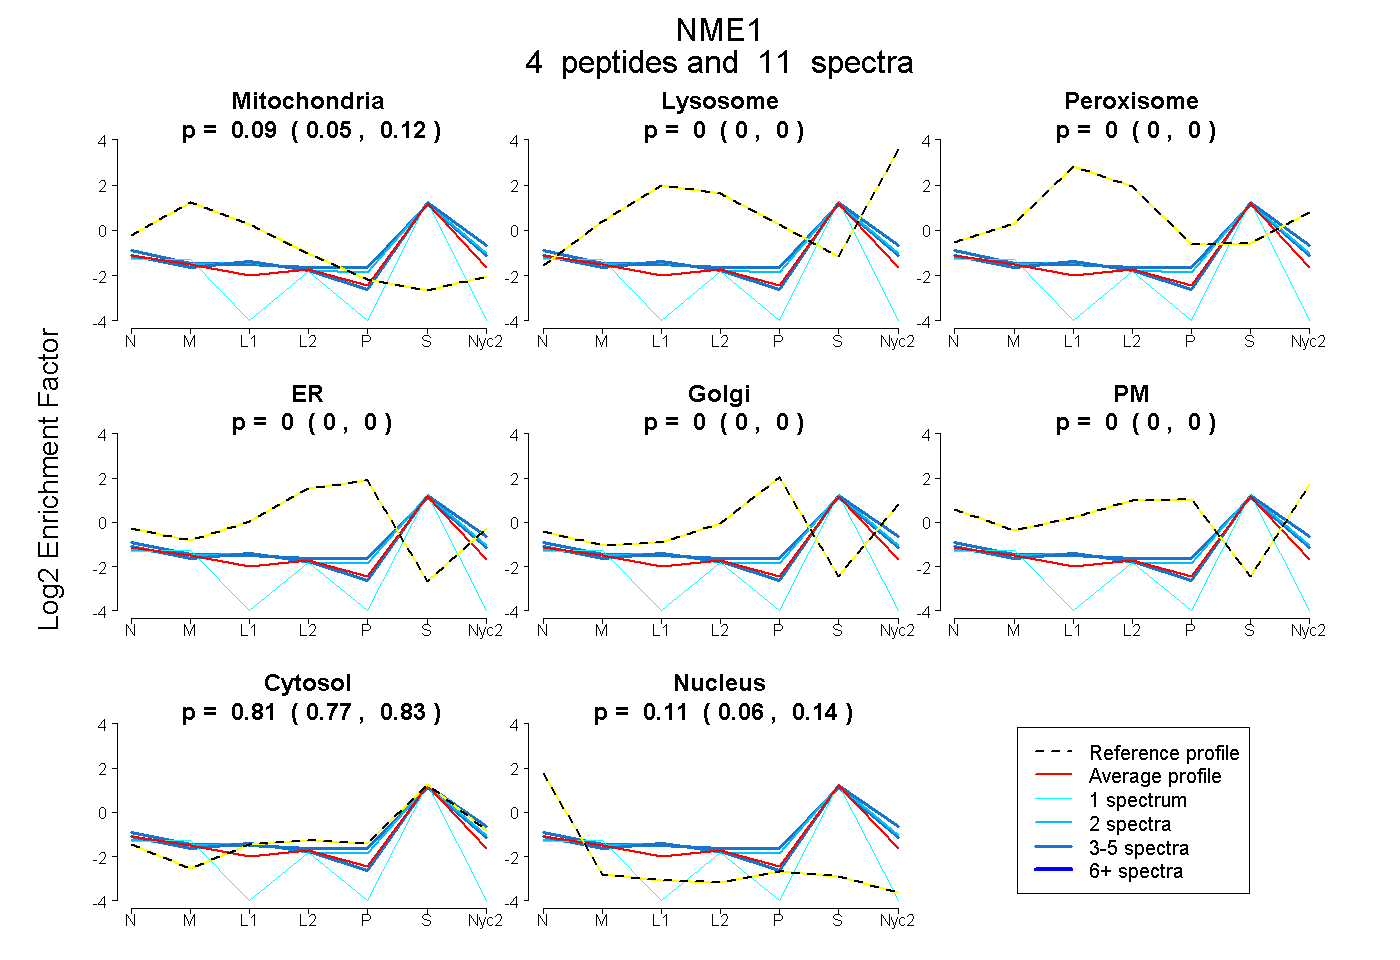
| Expt A |
4 peptides |
11 spectra |
|
0.089 0.054 | 0.119 |
0.000 0.000 | 0.000 |
0.000 0.000 | 0.000 |
0.000 0.000 | 0.000 |
0.000 0.000 | 0.000 |
0.000 0.000 | 0.000 |
0.805 0.775 | 0.832 |
0.106 0.064 | 0.140 |
| 4 spectra, DRPFFSGLVK | 0.142 | 0.000 | 0.000 | 0.000 | 0.000 | 0.000 | 0.836 | 0.021 | ||
| 1 spectrum, SCAQNWIYE | 0.000 | 0.000 | 0.000 | 0.000 | 0.000 | 0.000 | 0.597 | 0.403 | ||
| 4 spectra, FIQASEDLLK | 0.128 | 0.000 | 0.000 | 0.000 | 0.000 | 0.000 | 0.866 | 0.005 | ||
| 2 spectra, EISLWFQPEELVDYK | 0.137 | 0.000 | 0.000 | 0.000 | 0.000 | 0.000 | 0.863 | 0.000 |
| Plot | Mito | Lyso or Perox | ER | Golgi | PM | Cytosol | Nucleus | ||||||
| Expt B |
2 peptides |
9 spectra |
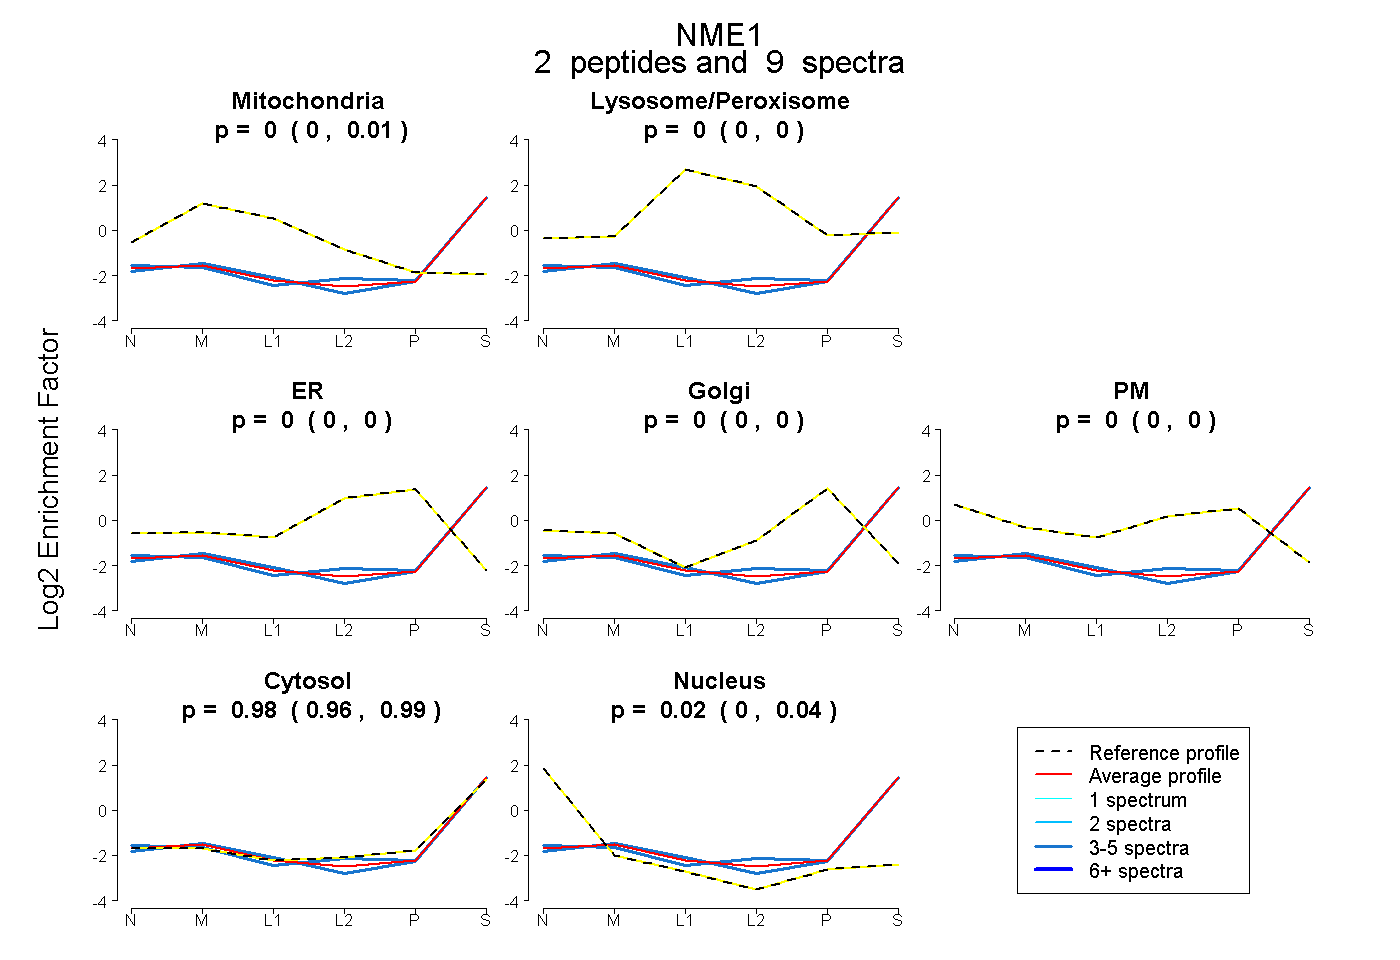 |
0.000 0.000 | 0.007 |
0.000 0.000 | 0.000 |
0.000 0.000 | 0.000 |
0.000 0.000 | 0.000 |
0.000 0.000 | 0.000 |
0.978 0.956 | 0.993 |
0.022 0.000 | 0.039 |
|||
| Plot | Lyso | Other | |||||||||||
| Expt C |
2 peptides |
7 spectra |
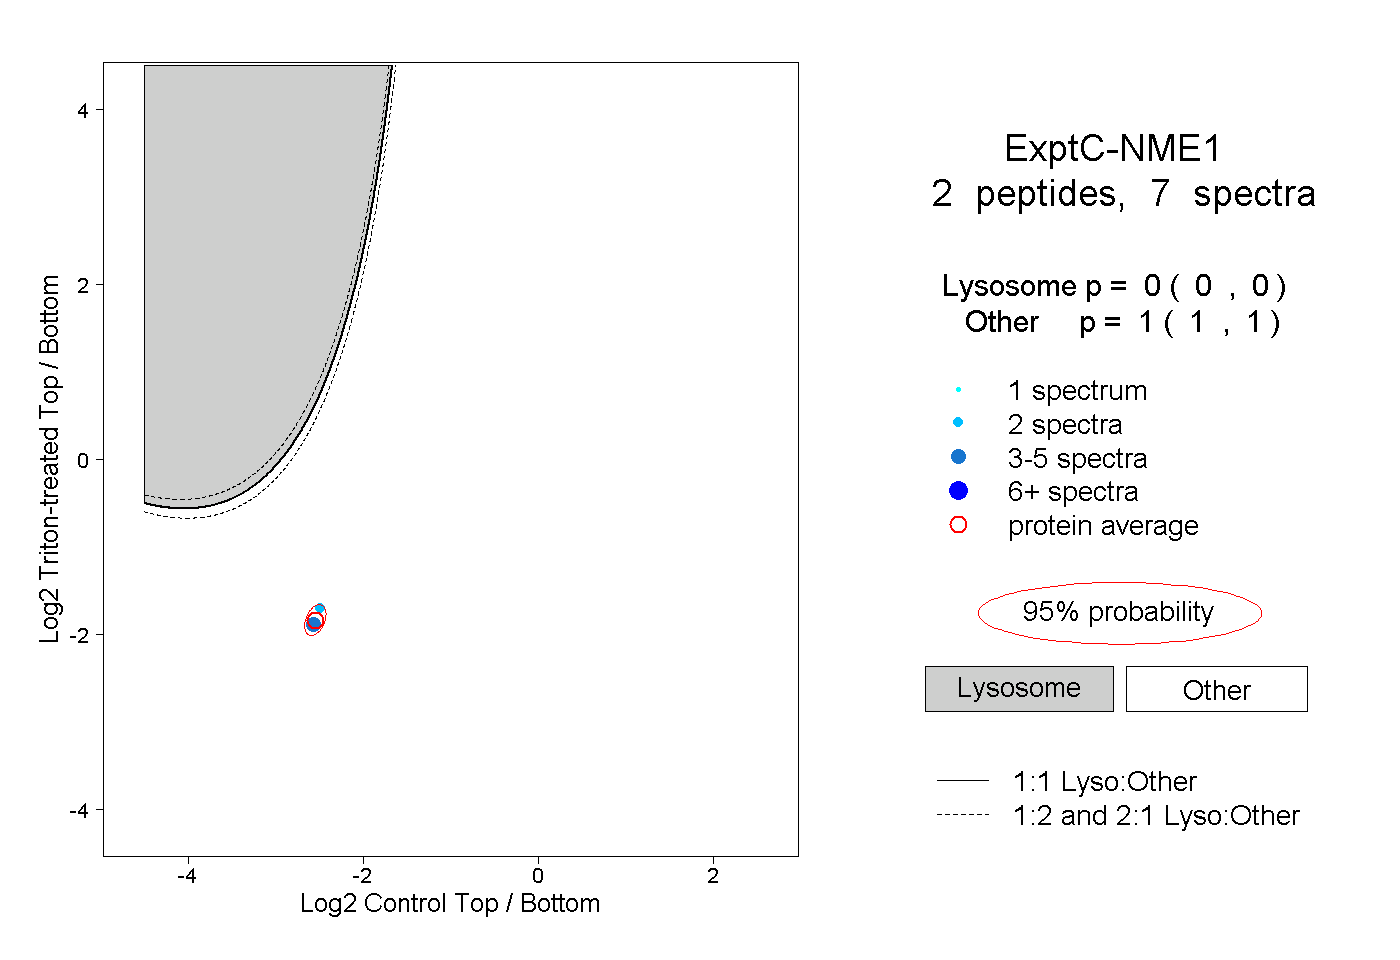 |
0.000 0.000 | 0.000 |
1.000 1.000 | 1.000 |