 6
6peptides
spectra
0.000 | 0.000
0.243 | 0.353
0.000 | 0.000
0.000 | 0.000
0.015 | 0.159
0.044 | 0.212
0.422 | 0.501
0.000 | 0.000
4peptides
spectra
0.000 | 0.002
0.998 | 1.000
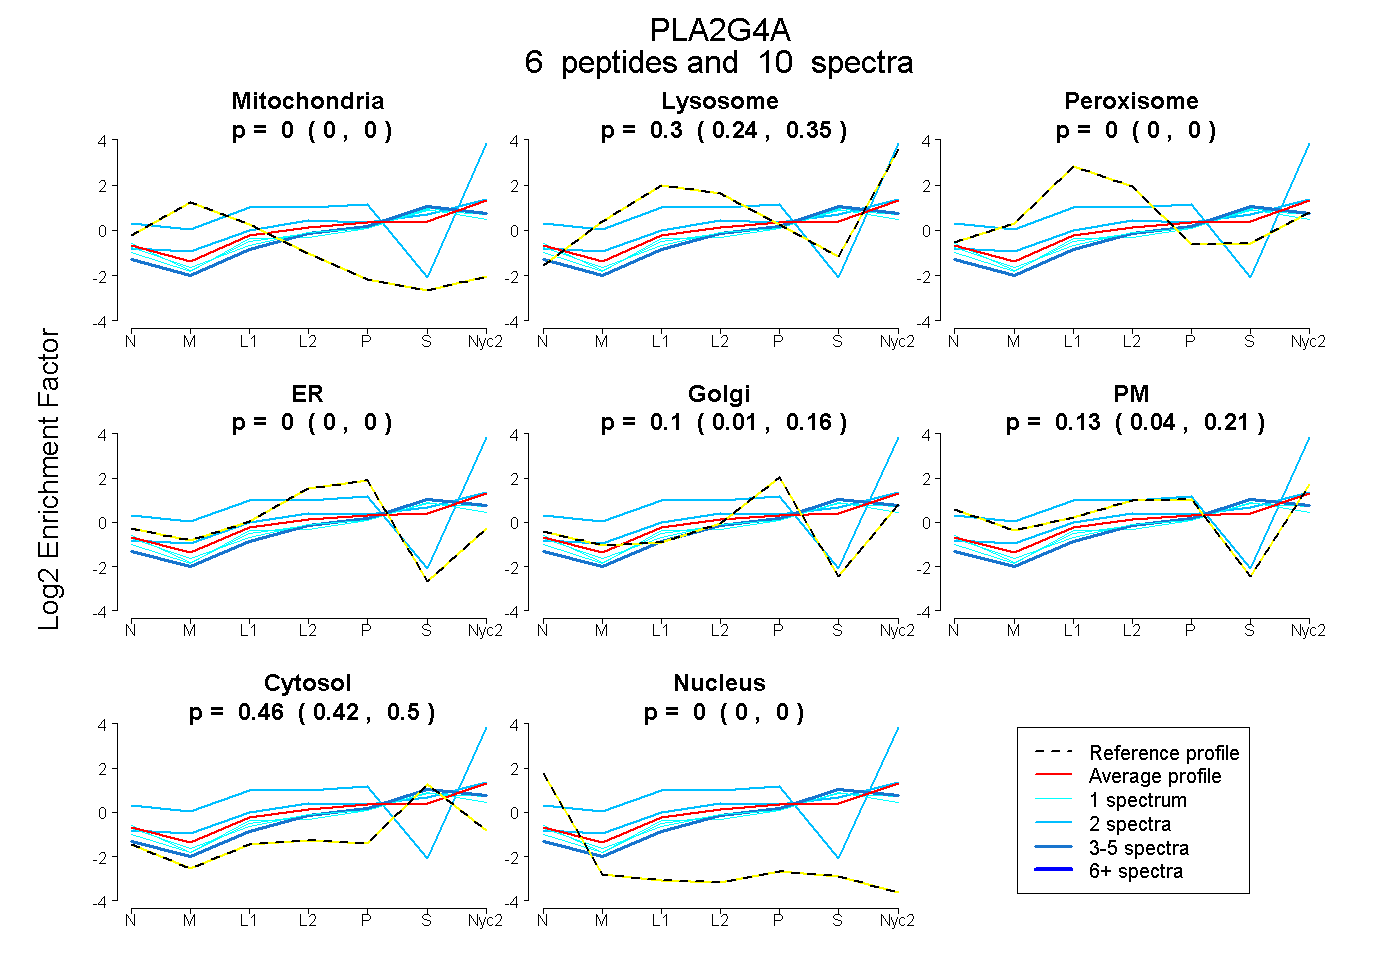
| Plot | Mito | Lyso | Perox | ER | Golgi | PM | Cytosol | Nucleus | |||||
| Expt A |
6 peptides |
10 spectra |
|
0.000 0.000 | 0.000 |
0.305 0.243 | 0.353 |
0.000 0.000 | 0.000 |
0.000 0.000 | 0.000 |
0.096 0.015 | 0.159 |
0.135 0.044 | 0.212 |
0.465 0.422 | 0.501 |
0.000 0.000 | 0.000 |
||
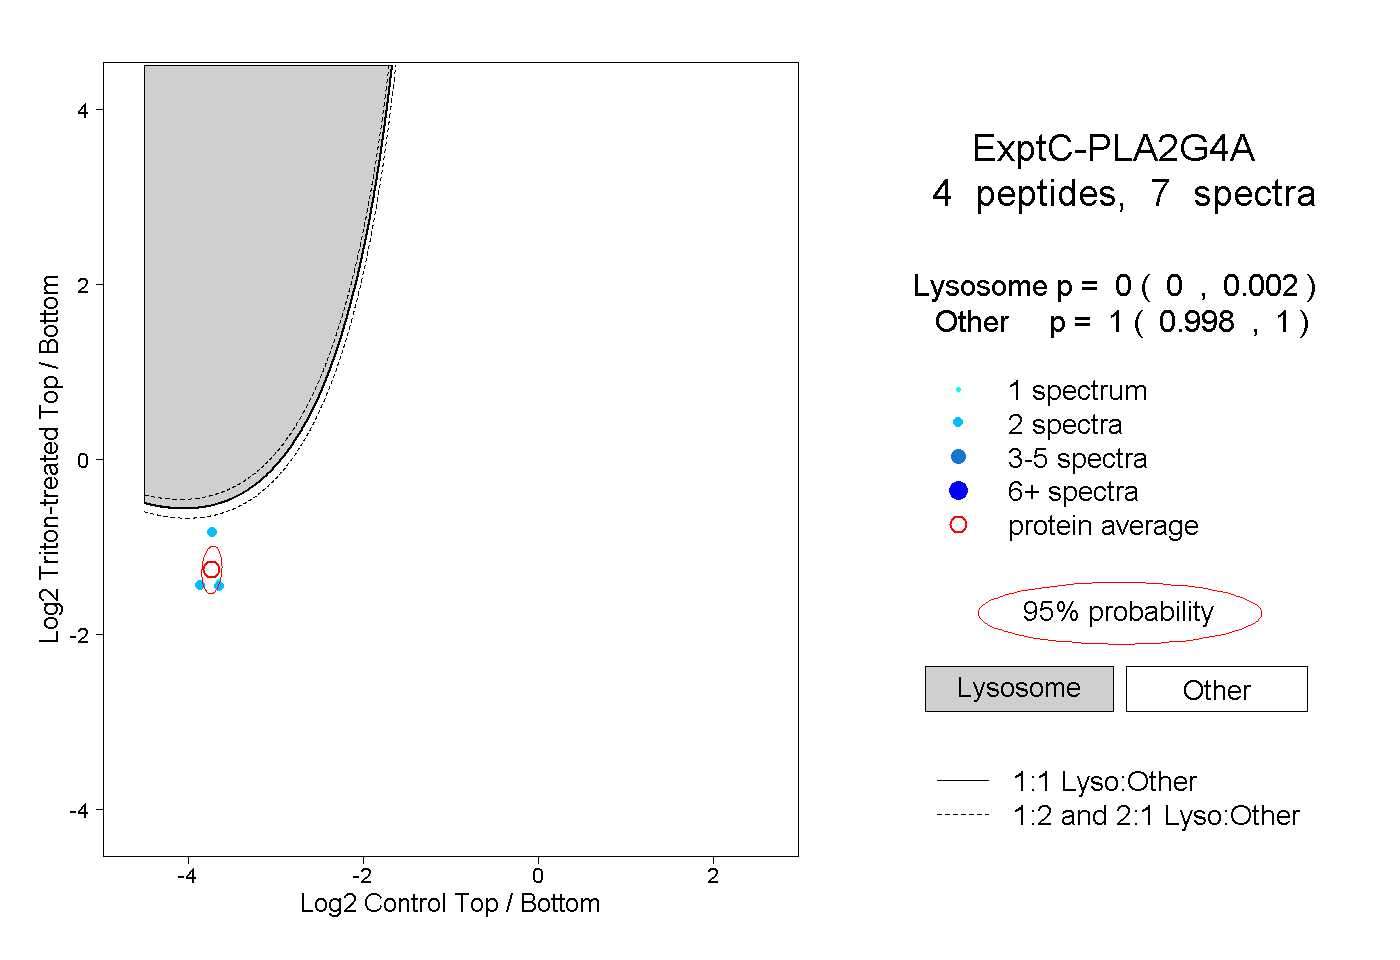
| Plot | Lyso | Other | |||||||||||
| Expt C |
4 peptides |
7 spectra |
|
0.000 0.000 | 0.002 |
1.000 0.998 | 1.000 |