 6
6peptides
spectra
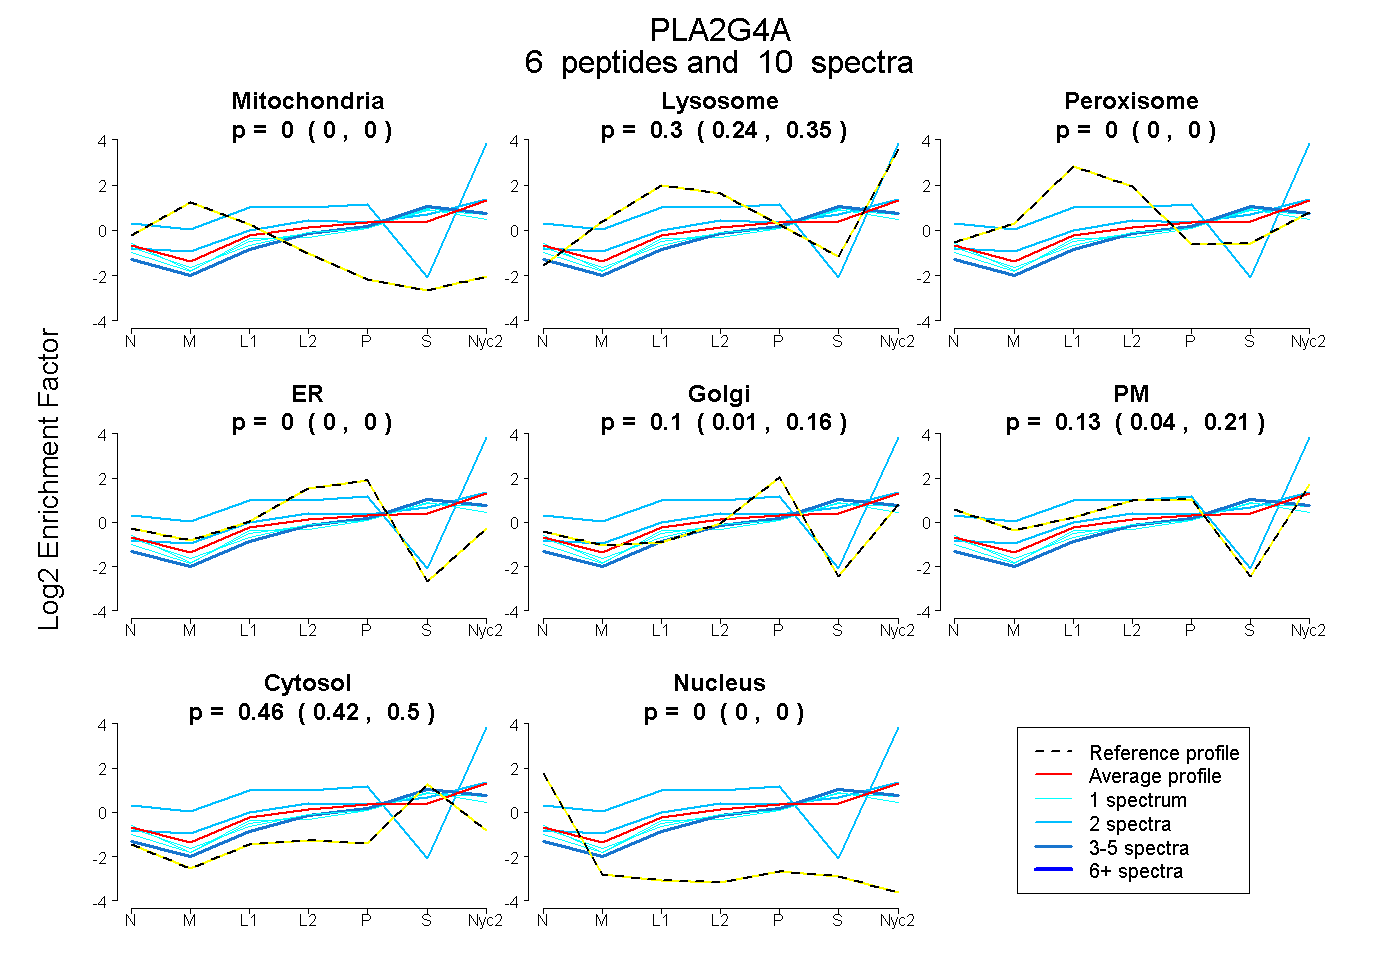
0.000 | 0.000
0.243 | 0.353
0.000 | 0.000
0.000 | 0.000
0.015 | 0.159
0.044 | 0.212
0.422 | 0.501
0.000 | 0.000
| Plot | Mito | Lyso | Perox | ER | Golgi | PM | Cytosol | Nucleus | |||||
| Expt A |
6 peptides |
10 spectra |
|
0.000 0.000 | 0.000 |
0.305 0.243 | 0.353 |
0.000 0.000 | 0.000 |
0.000 0.000 | 0.000 |
0.096 0.015 | 0.159 |
0.135 0.044 | 0.212 |
0.465 0.422 | 0.501 |
0.000 0.000 | 0.000 |
| 1 spectrum, GSTMEEELENITAK | 0.000 | 0.174 | 0.000 | 0.024 | 0.049 | 0.128 | 0.625 | 0.000 | ||
| 3 spectra, FTVVVLR | 0.000 | 0.229 | 0.000 | 0.000 | 0.125 | 0.000 | 0.646 | 0.000 | ||
| 1 spectrum, DVPVVAILGSGGGFR | 0.000 | 0.176 | 0.000 | 0.000 | 0.026 | 0.191 | 0.607 | 0.000 | ||
| 2 spectra, APGVLR | 0.000 | 0.466 | 0.000 | 0.000 | 0.000 | 0.534 | 0.000 | 0.000 | ||
| 2 spectra, ELLLAEK | 0.000 | 0.398 | 0.005 | 0.000 | 0.039 | 0.103 | 0.454 | 0.000 | ||
| 1 spectrum, DAIVESIEYR | 0.000 | 0.277 | 0.000 | 0.000 | 0.100 | 0.000 | 0.624 | 0.000 |
| Plot | Lyso | Other | |||||||||||
| Expt C |
4 peptides |
7 spectra |
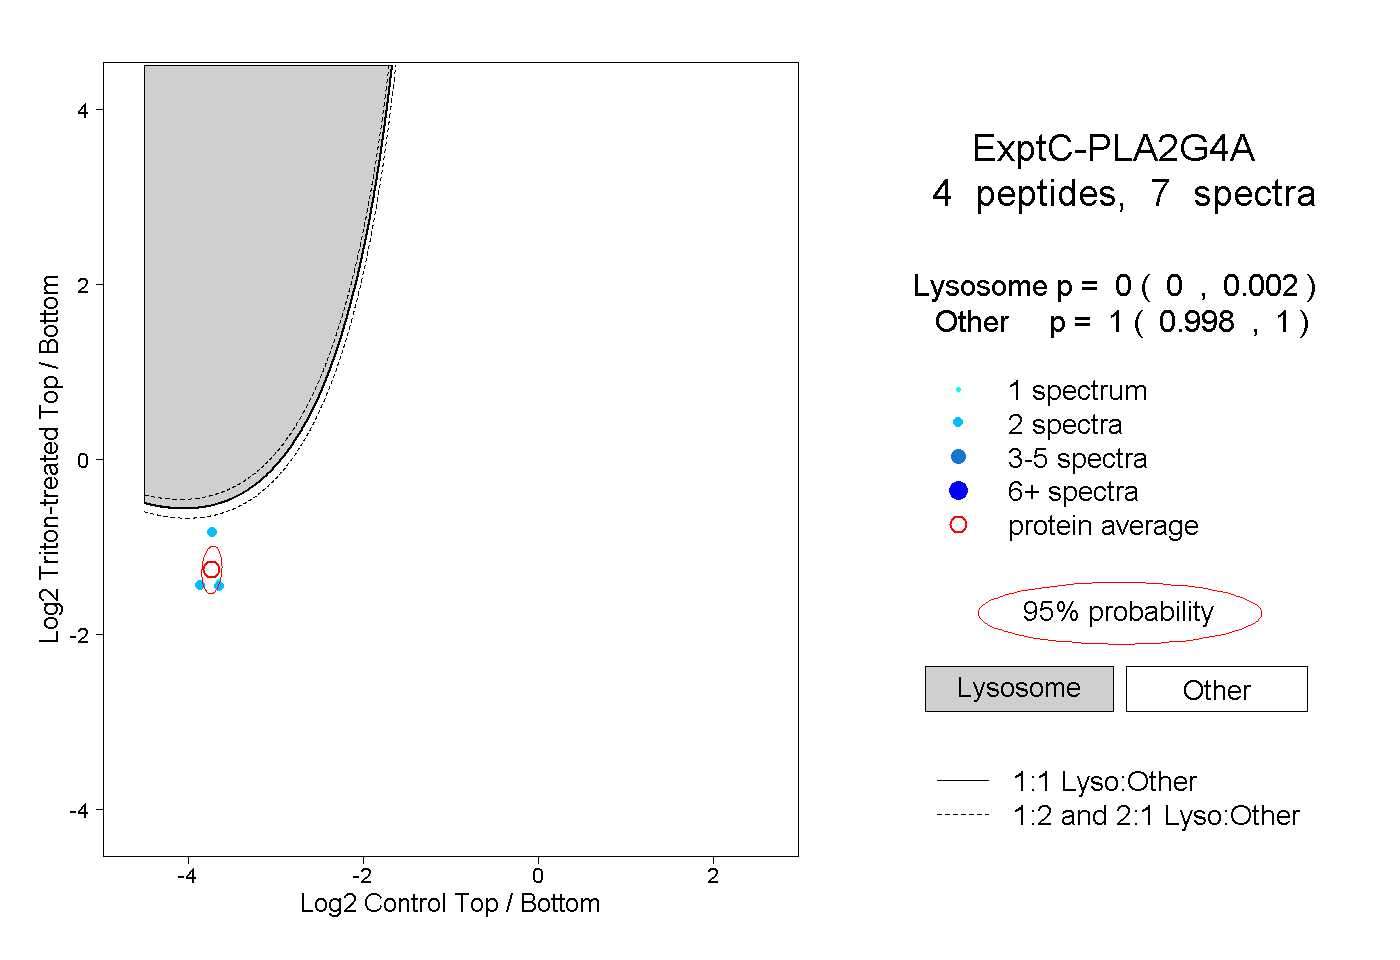 |
0.000 0.000 | 0.002 |
1.000 0.998 | 1.000 |