 4
4peptides
spectra
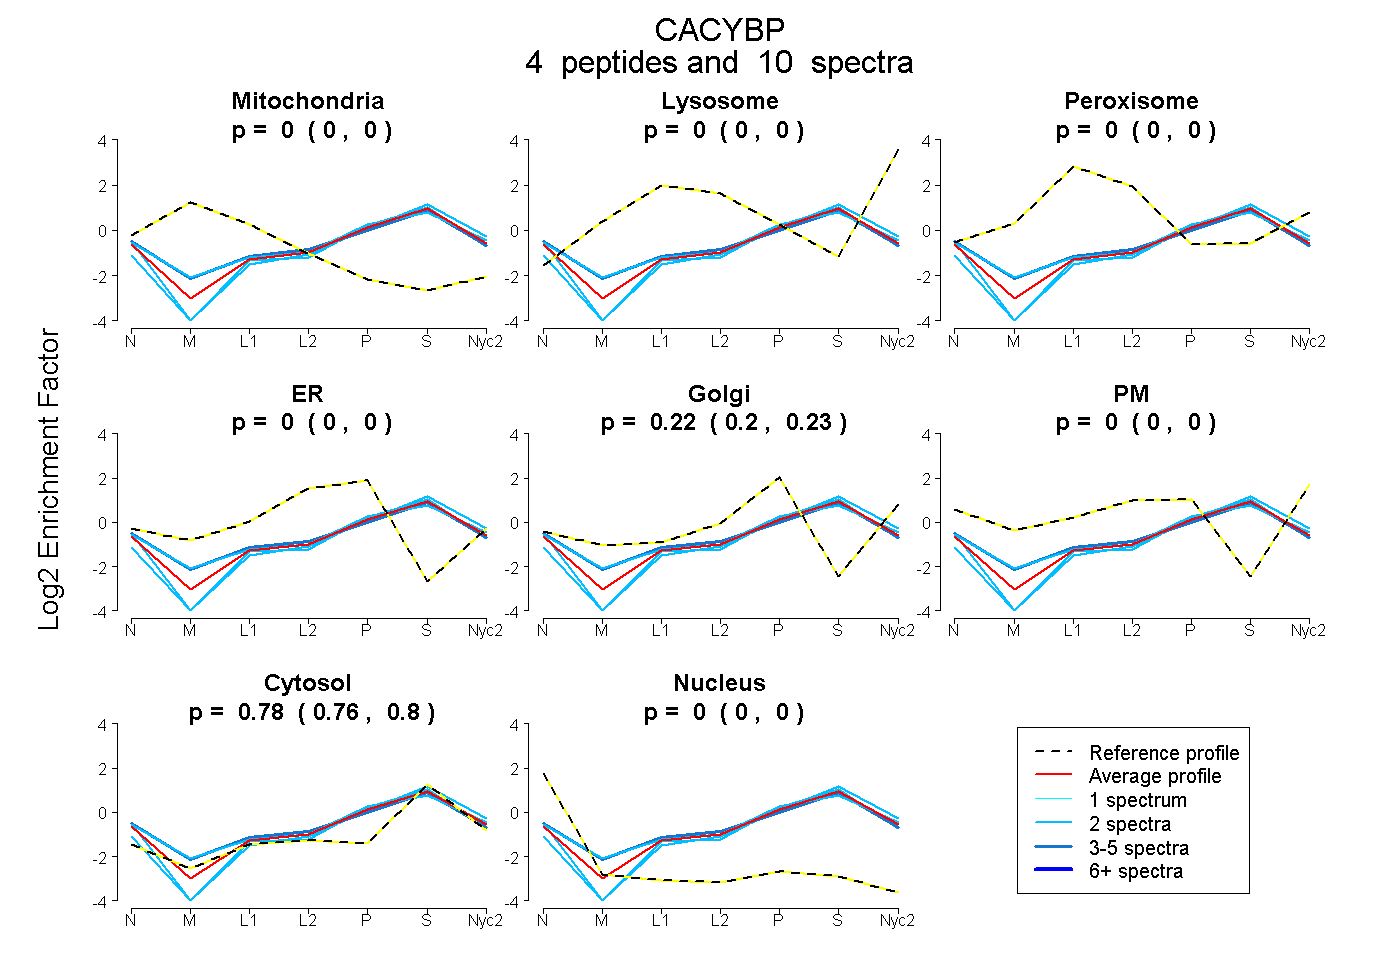
0.000 | 0.000
0.000 | 0.000
0.000 | 0.000
0.000 | 0.000
0.201 | 0.234
0.000 | 0.000
0.763 | 0.796
0.000 | 0.000
3peptides
spectra
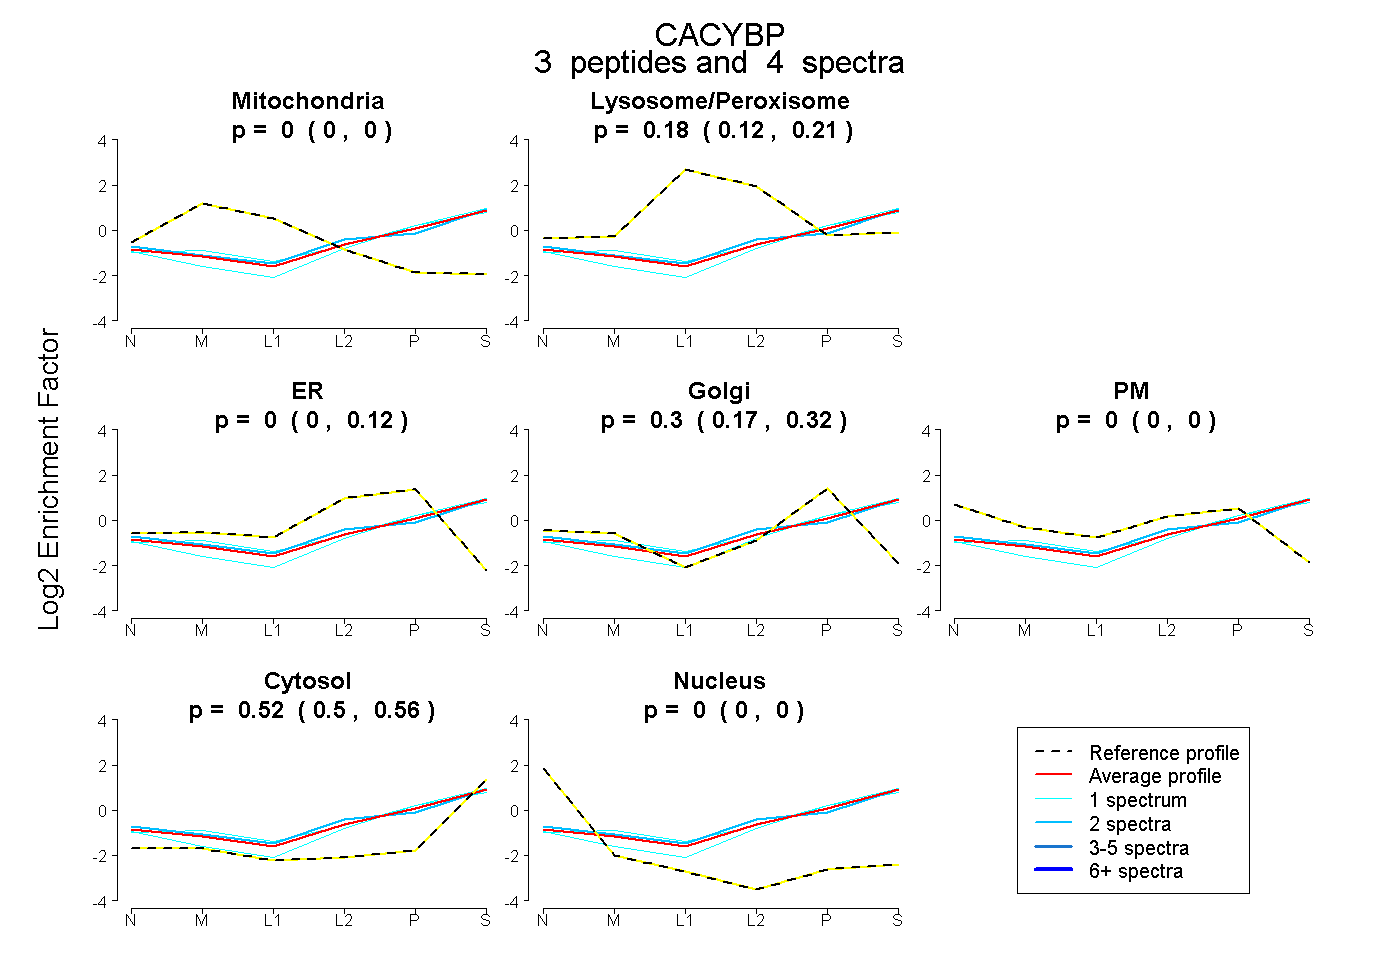
0.000 | 0.000
0.116 | 0.207
0.000 | 0.122
0.172 | 0.317
0.000 | 0.000
0.498 | 0.558
0.000 | 0.000
5peptides
spectra
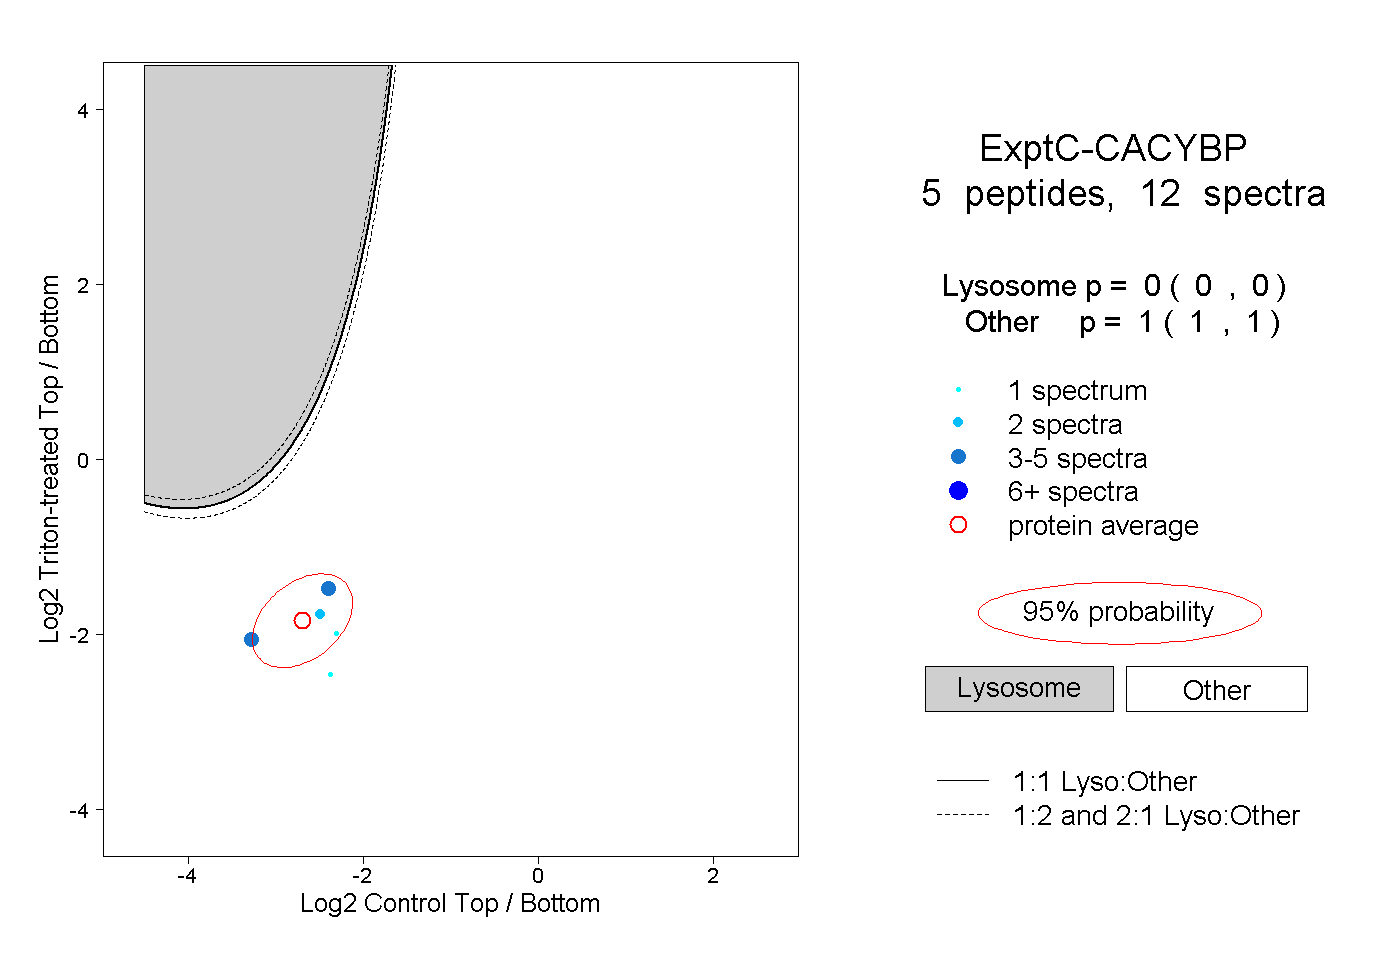
0.000 | 0.000
1.000 | 1.000