CACYBP
[ENSRNOP00000003586]
Main page
| | | Plot |
Mito |
Lyso |
|
Perox |
ER |
Golgi |
PM |
Cytosol |
Nucleus |
|
| Expt A |
 4
4
peptides |
10
spectra |
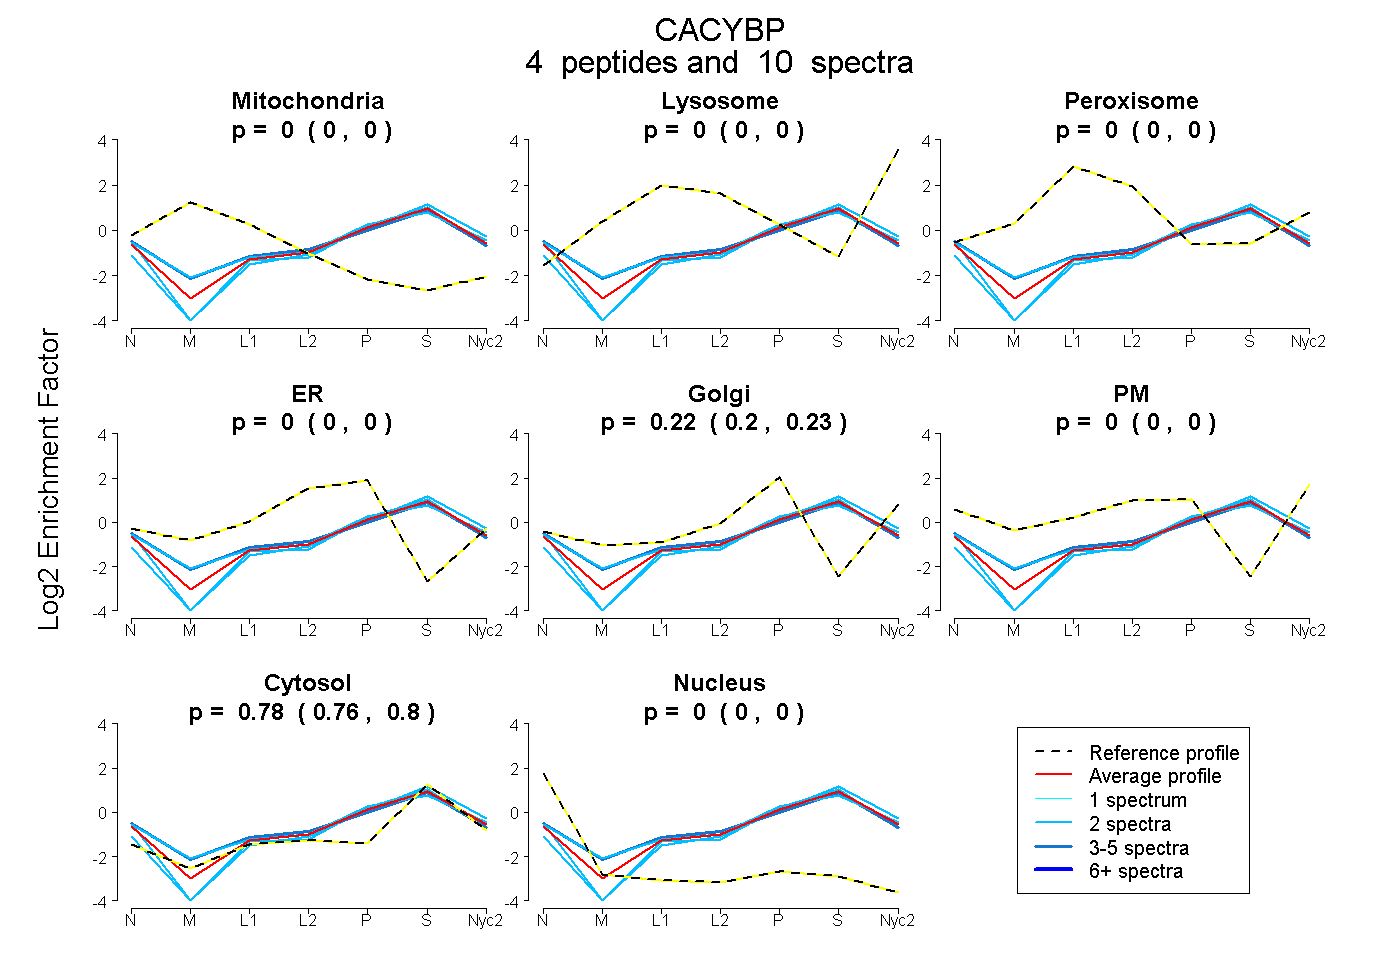 |
0.000
0.000 | 0.000 |
0.000
0.000 | 0.000 |
|
0.000
0.000 | 0.000 |
0.000
0.000 | 0.000 |
0.220
0.201 | 0.234 |
0.000
0.000 | 0.000 |
0.780
0.763 | 0.796 |
0.000
0.000 | 0.000 |
|
| | | Plot |
Mito |
|
Lyso or Perox |
|
ER |
Golgi |
PM |
Cytosol |
Nucleus |
|
| Expt B |
3
peptides |
4
spectra |
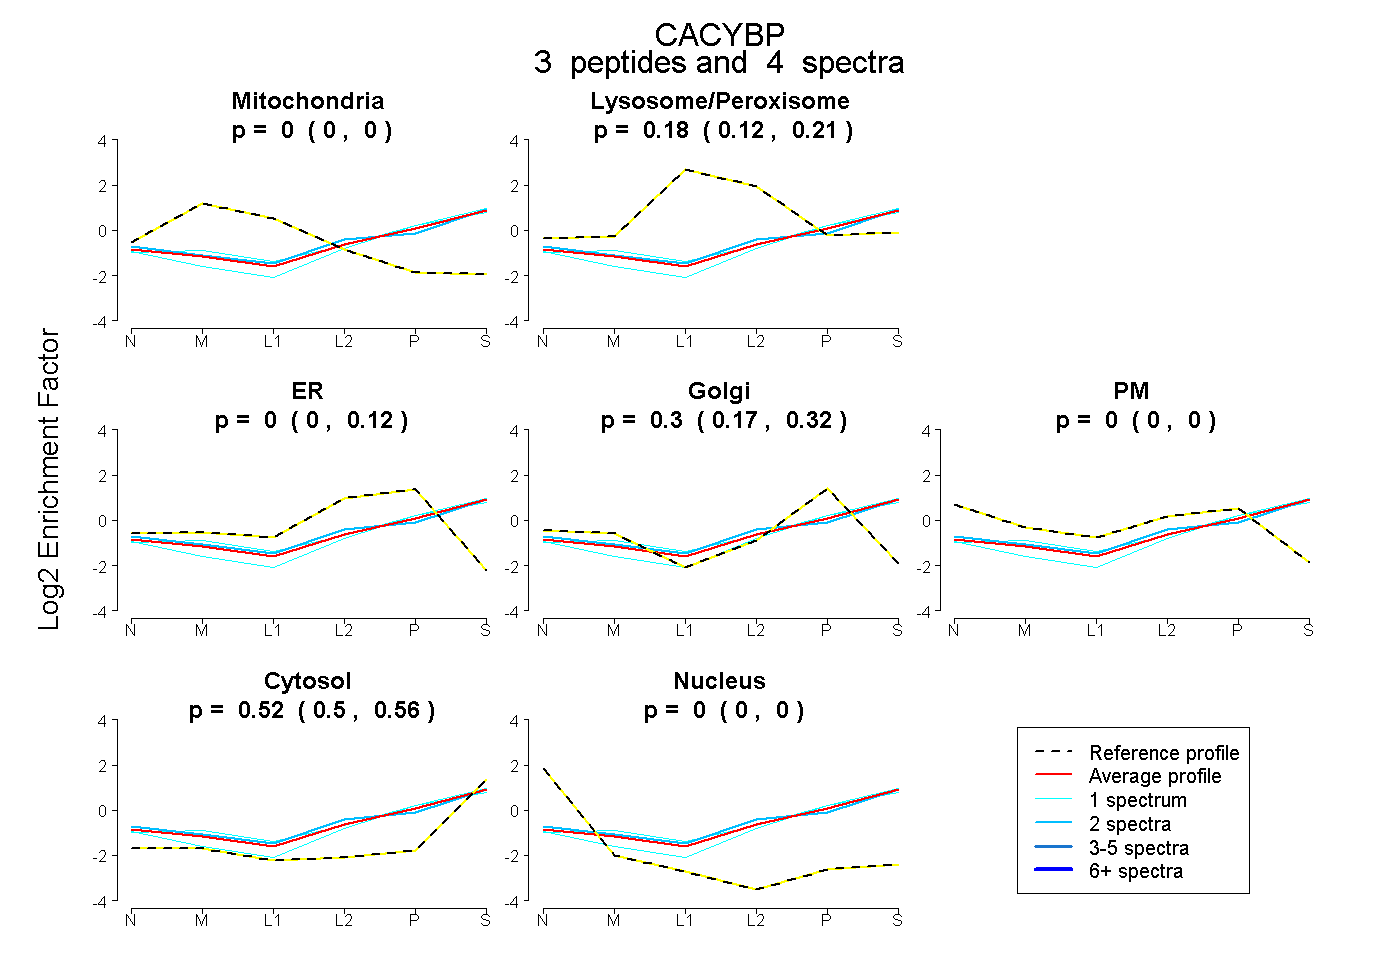 |
0.000
0.000 | 0.000 |
|
0.182
0.116 | 0.207 |
|
0.000
0.000 | 0.122 |
0.300
0.172 | 0.317 |
0.000
0.000 | 0.000 |
0.518
0.498 | 0.558 |
0.000
0.000 | 0.000 |
|
| 2 spectra, TDTVIILCR |
0.000 |
|
0.215 |
|
0.031 |
0.232 |
0.000 |
0.521 |
0.000 |
|
| 1 spectrum, DLEEVK |
0.000 |
|
0.205 |
|
0.000 |
0.316 |
0.000 |
0.478 |
0.000 |
|
| 1 spectrum, SFDLLVK |
0.000 |
|
0.024 |
|
0.198 |
0.166 |
0.000 |
0.611 |
0.000 |
|
| | | Plot |
|
Lyso |
|
|
|
|
|
|
|
Other |
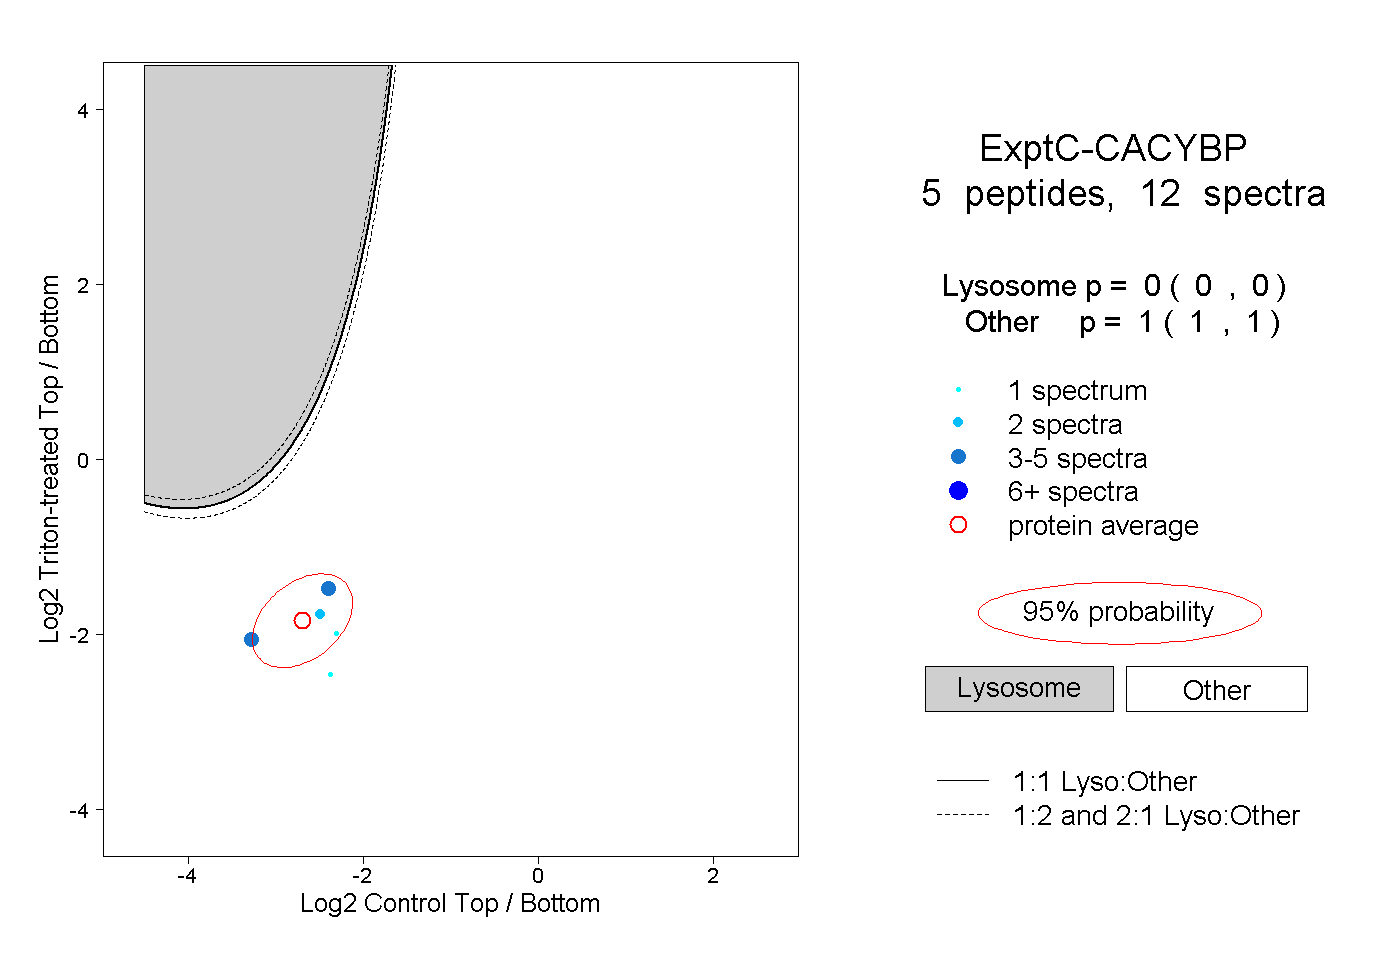
| Expt C |
5
peptides |
12
spectra |
 |
|
0.000
0.000 | 0.000 |
|
|
|
|
|
|
|
1.000
1.000 | 1.000 |