 16
16peptides
spectra
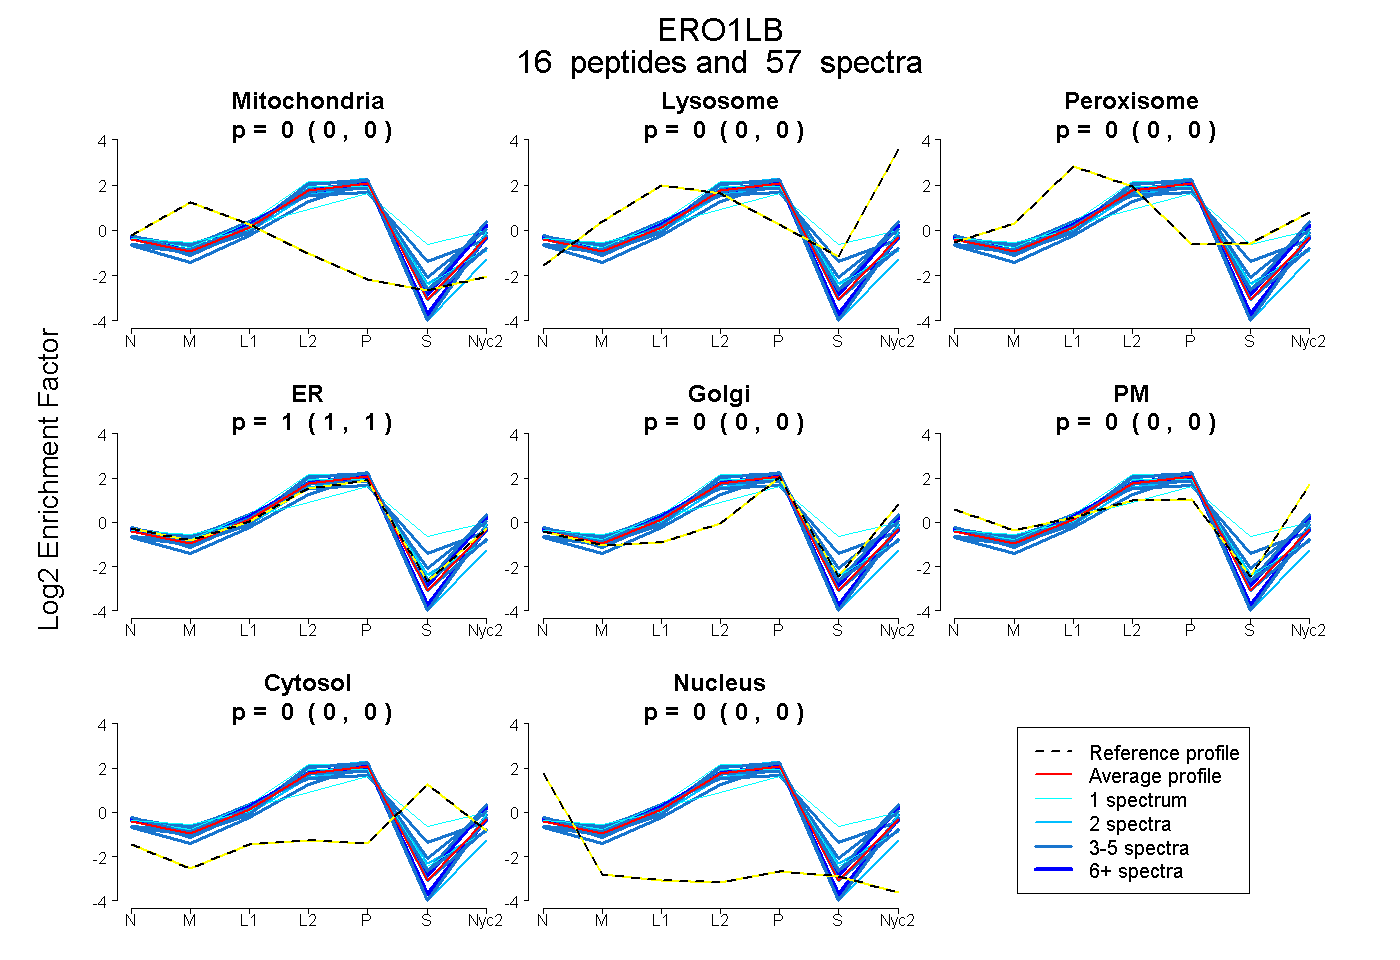
0.000 | 0.000
0.000 | 0.000
0.000 | 0.000
1.000 | 1.000
0.000 | 0.000
0.000 | 0.000
0.000 | 0.000
0.000 | 0.000
8peptides
spectra
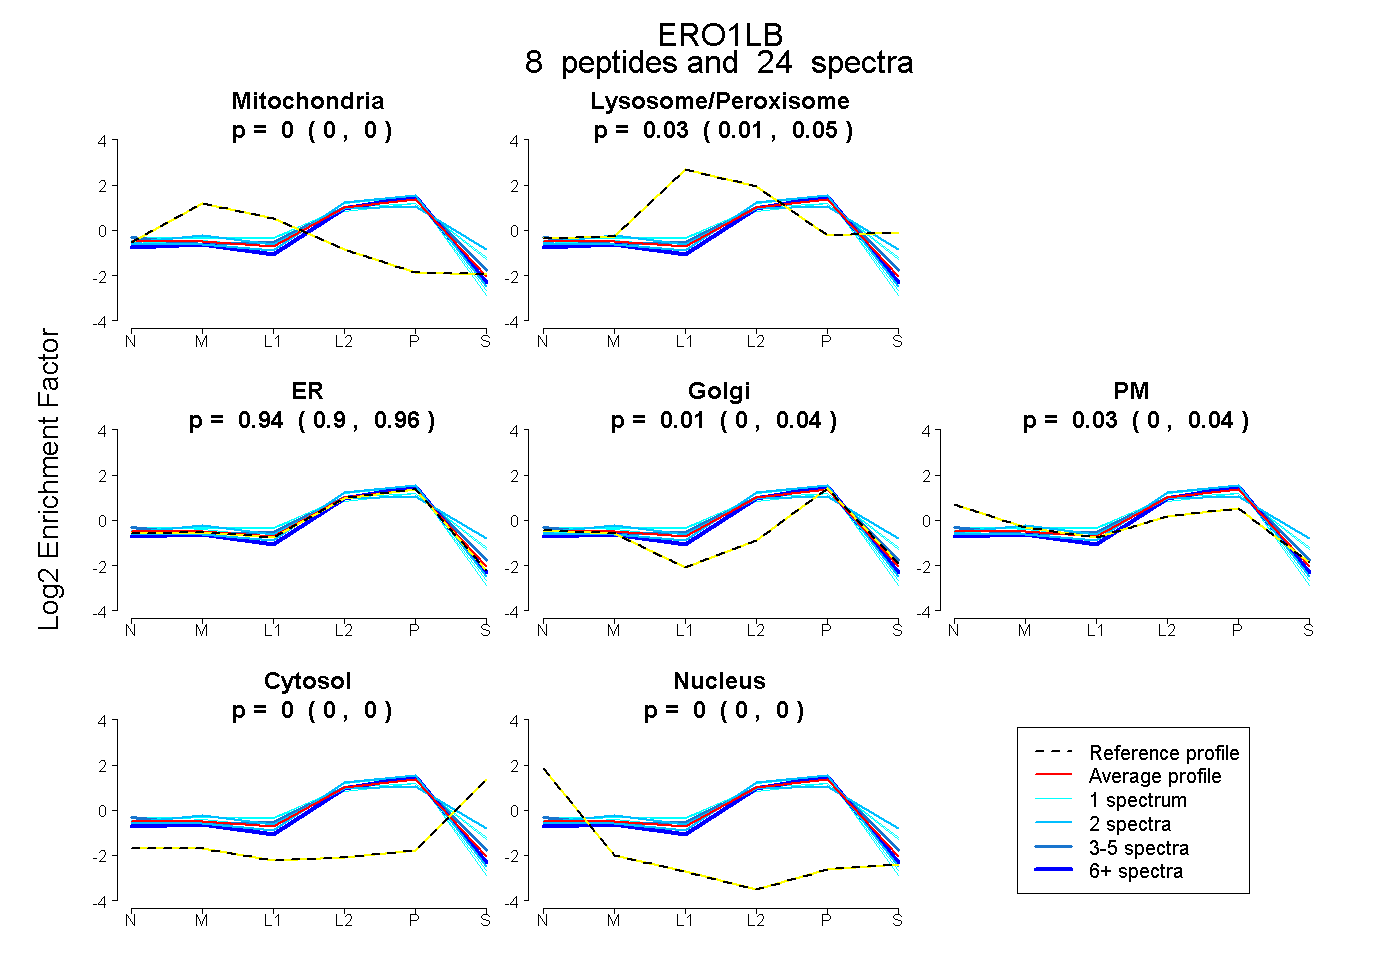
0.000 | 0.000
0.009 | 0.045
0.902 | 0.960
0.000 | 0.037
0.000 | 0.042
0.000 | 0.003
0.000 | 0.000
14peptides
spectra
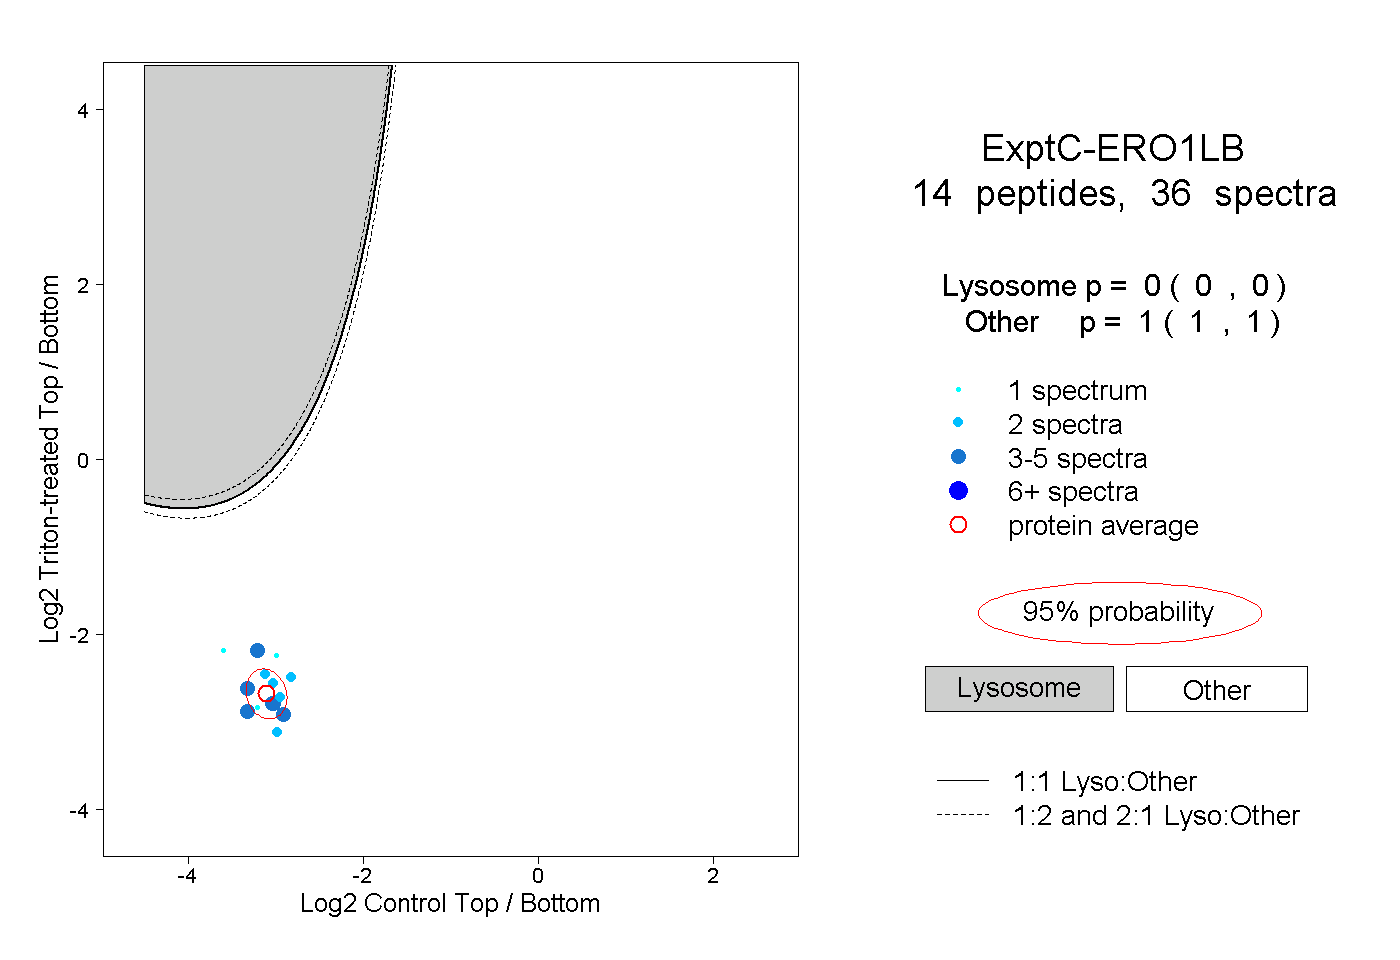
0.000 | 0.000
1.000 | 1.000
7peptides
spectra
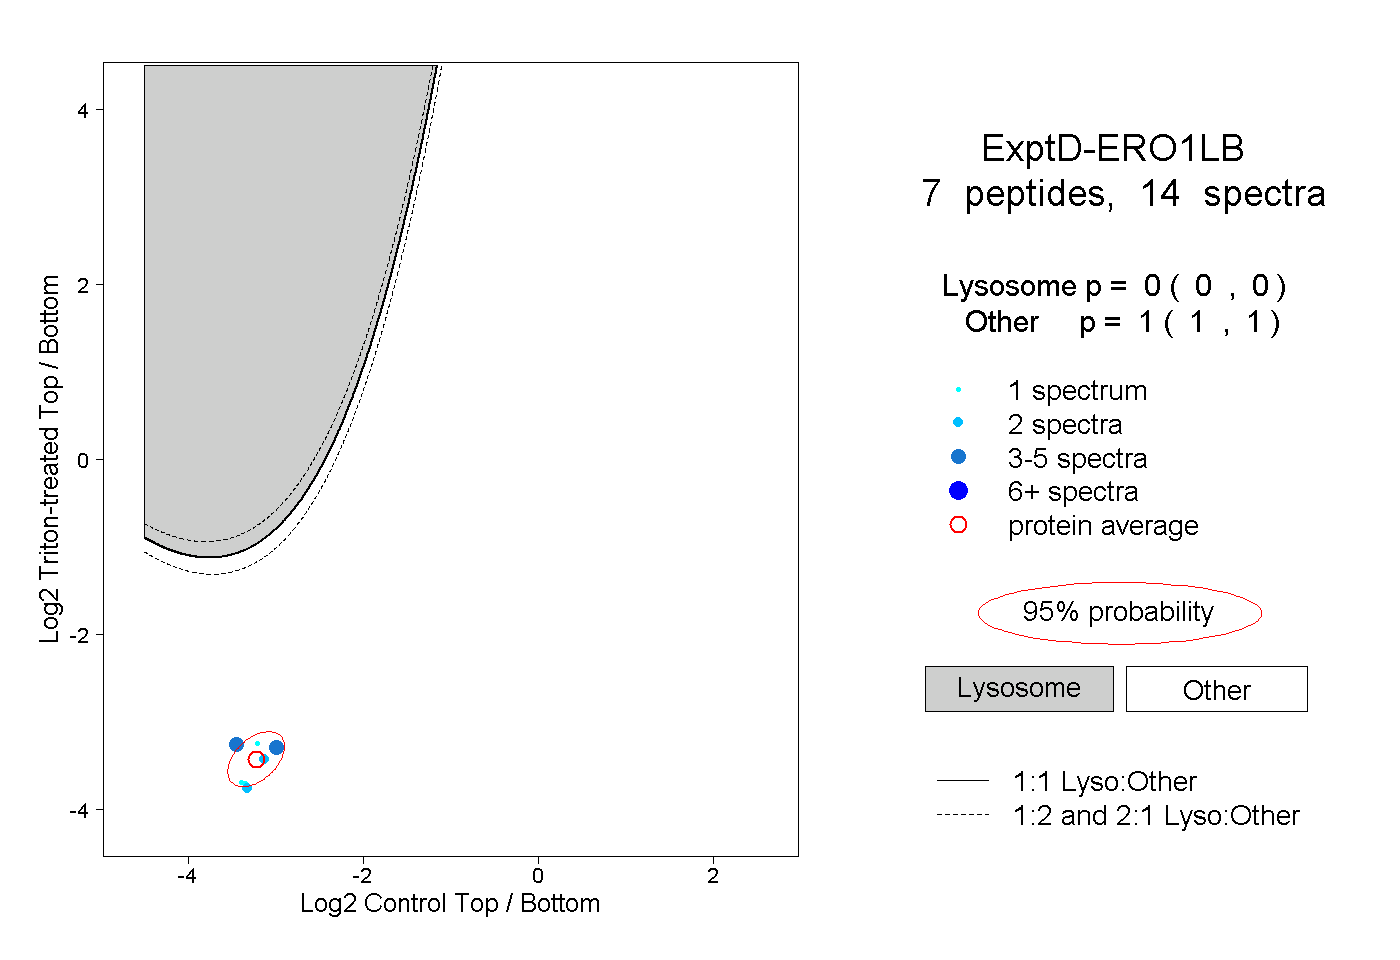
0.000 | 0.000
1.000 | 1.000