 16
16peptides
spectra
0.000 | 0.000
0.000 | 0.000
0.000 | 0.000
1.000 | 1.000
0.000 | 0.000
0.000 | 0.000
0.000 | 0.000
0.000 | 0.000
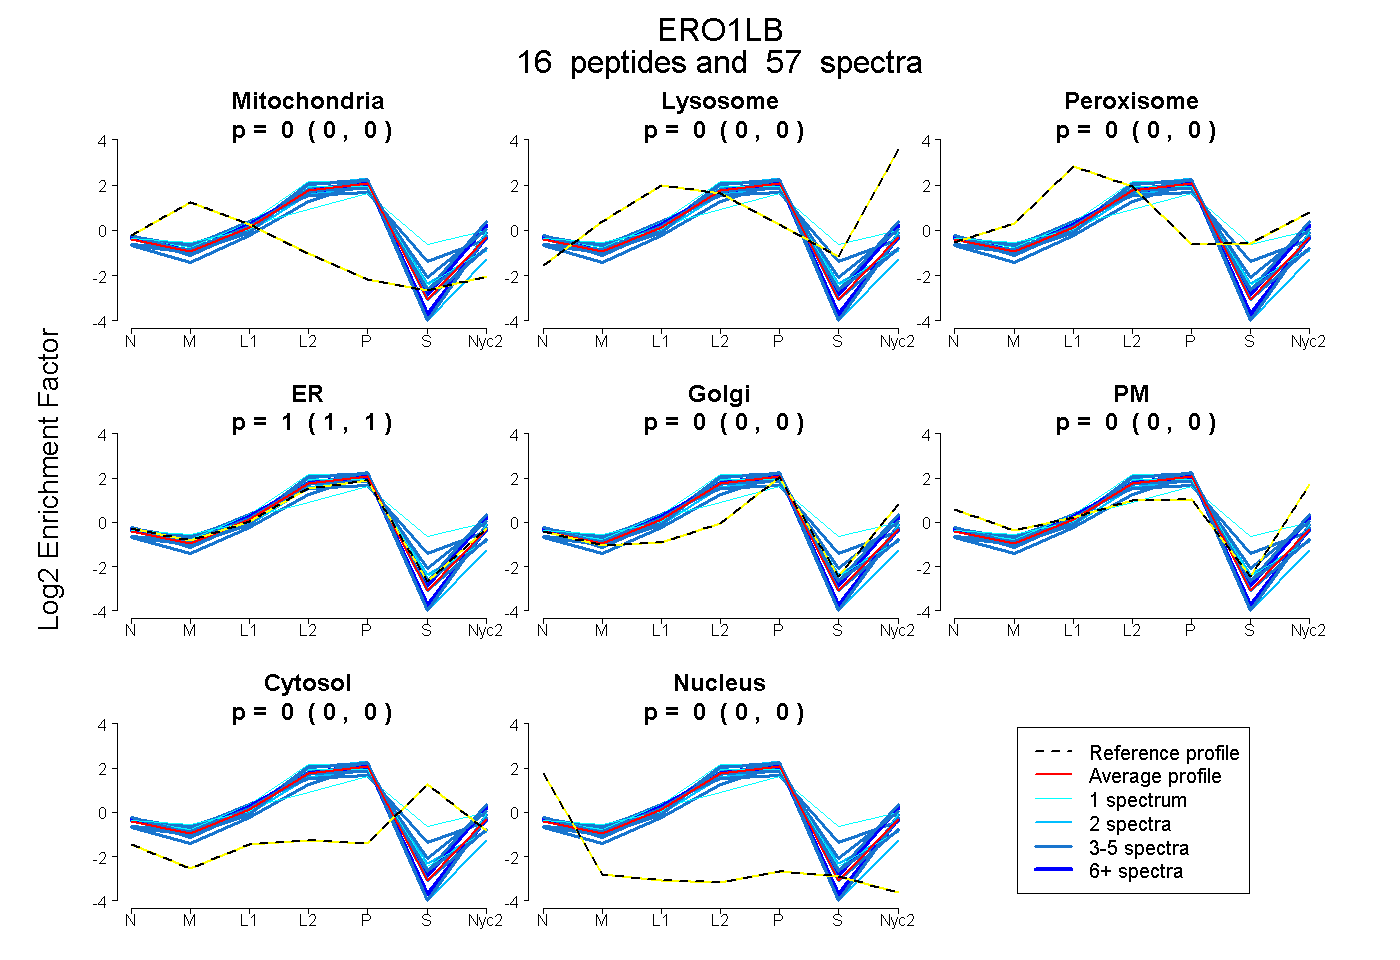
| Plot | Mito | Lyso | Perox | ER | Golgi | PM | Cytosol | Nucleus | |||||
| Expt A |
16 peptides |
57 spectra |
|
0.000 0.000 | 0.000 |
0.000 0.000 | 0.000 |
0.000 0.000 | 0.000 |
1.000 1.000 | 1.000 |
0.000 0.000 | 0.000 |
0.000 0.000 | 0.000 |
0.000 0.000 | 0.000 |
0.000 0.000 | 0.000 |
| 1 spectrum, QEIVALLNAFGR | 0.000 | 0.000 | 0.000 | 1.000 | 0.000 | 0.000 | 0.000 | 0.000 | ||
| 6 spectra, GFQLTR | 0.000 | 0.032 | 0.000 | 0.910 | 0.000 | 0.058 | 0.000 | 0.000 | ||
| 14 spectra, SVYRPLNPLAPSR | 0.000 | 0.000 | 0.000 | 1.000 | 0.000 | 0.000 | 0.000 | 0.000 | ||
| 4 spectra, YDDSQDHFCELDDER | 0.000 | 0.000 | 0.000 | 1.000 | 0.000 | 0.000 | 0.000 | 0.000 | ||
| 4 spectra, VAPYFER | 0.000 | 0.000 | 0.000 | 1.000 | 0.000 | 0.000 | 0.000 | 0.000 | ||
| 4 spectra, SPAAQYVDLLLNPER | 0.000 | 0.077 | 0.000 | 0.900 | 0.006 | 0.016 | 0.000 | 0.000 | ||
| 3 spectra, ILFSEK | 0.000 | 0.000 | 0.000 | 1.000 | 0.000 | 0.000 | 0.000 | 0.000 | ||
| 2 spectra, ELQNFK | 0.000 | 0.000 | 0.000 | 1.000 | 0.000 | 0.000 | 0.000 | 0.000 | ||
| 2 spectra, ELDDCEQANK | 0.000 | 0.000 | 0.000 | 1.000 | 0.000 | 0.000 | 0.000 | 0.000 | ||
| 4 spectra, EAFIDWAR | 0.000 | 0.000 | 0.000 | 1.000 | 0.000 | 0.000 | 0.000 | 0.000 | ||
| 1 spectrum, SIVDLYTGNLEDDADTK | 0.000 | 0.000 | 0.196 | 0.443 | 0.177 | 0.000 | 0.184 | 0.000 | ||
| 3 spectra, DCHVEPCPESK | 0.000 | 0.000 | 0.155 | 0.750 | 0.000 | 0.000 | 0.095 | 0.000 | ||
| 3 spectra, TLLLSIFQDTK | 0.000 | 0.051 | 0.034 | 0.889 | 0.000 | 0.000 | 0.026 | 0.000 | ||
| 2 spectra, ALLAGHR | 0.000 | 0.000 | 0.000 | 0.947 | 0.000 | 0.000 | 0.028 | 0.025 | ||
| 1 spectrum, VWNSIYEENCFKPR | 0.012 | 0.000 | 0.000 | 0.988 | 0.000 | 0.000 | 0.000 | 0.000 | ||
| 3 spectra, IPVGIK | 0.000 | 0.000 | 0.000 | 0.935 | 0.000 | 0.000 | 0.031 | 0.034 |
| Plot | Mito | Lyso or Perox | ER | Golgi | PM | Cytosol | Nucleus | ||||||
| Expt B |
8 peptides |
24 spectra |
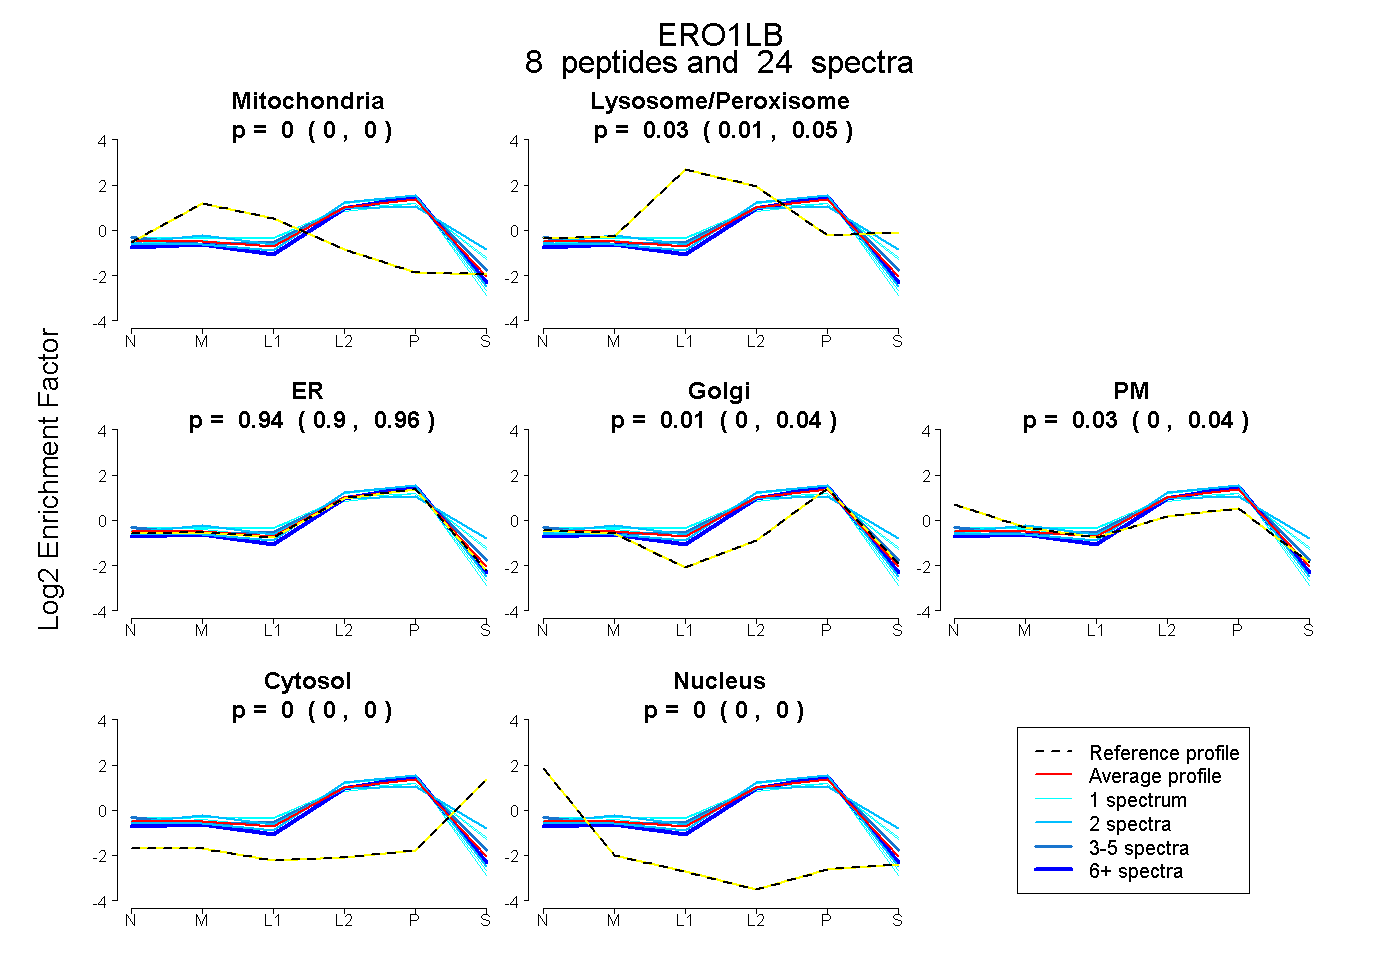 |
0.000 0.000 | 0.000 |
0.027 0.009 | 0.045 |
0.937 0.902 | 0.960 |
0.009 0.000 | 0.037 |
0.027 0.000 | 0.042 |
0.000 0.000 | 0.003 |
0.000 0.000 | 0.000 |
|||
| Plot | Lyso | Other | |||||||||||
| Expt C |
14 peptides |
36 spectra |
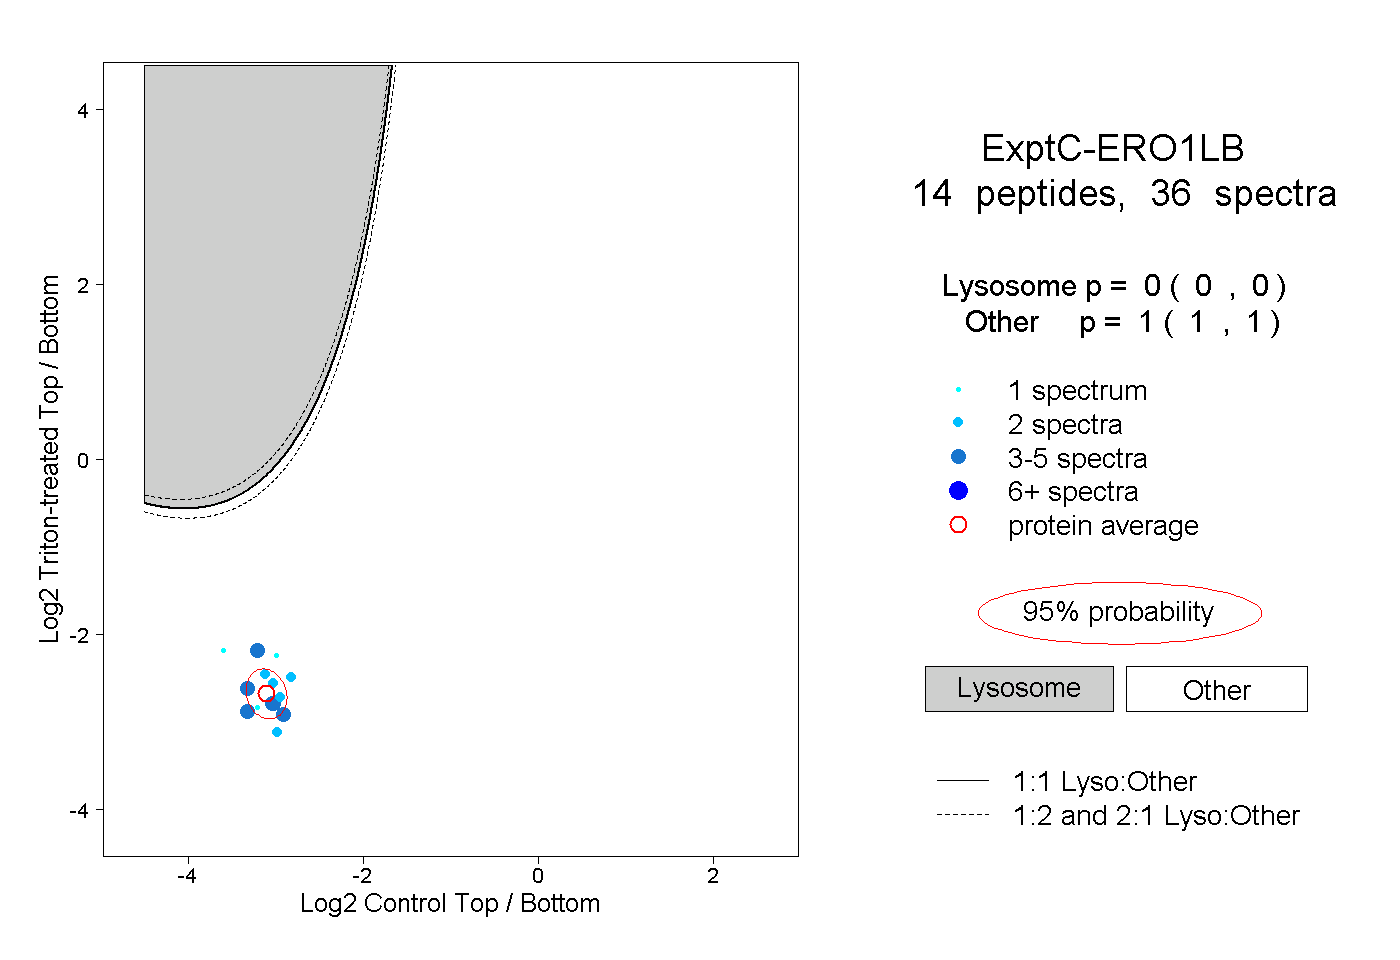 |
0.000 0.000 | 0.000 |
1.000 1.000 | 1.000 |
||||||||
| Plot | Lyso | Other | |||||||||||
| Expt D |
7 peptides |
14 spectra |
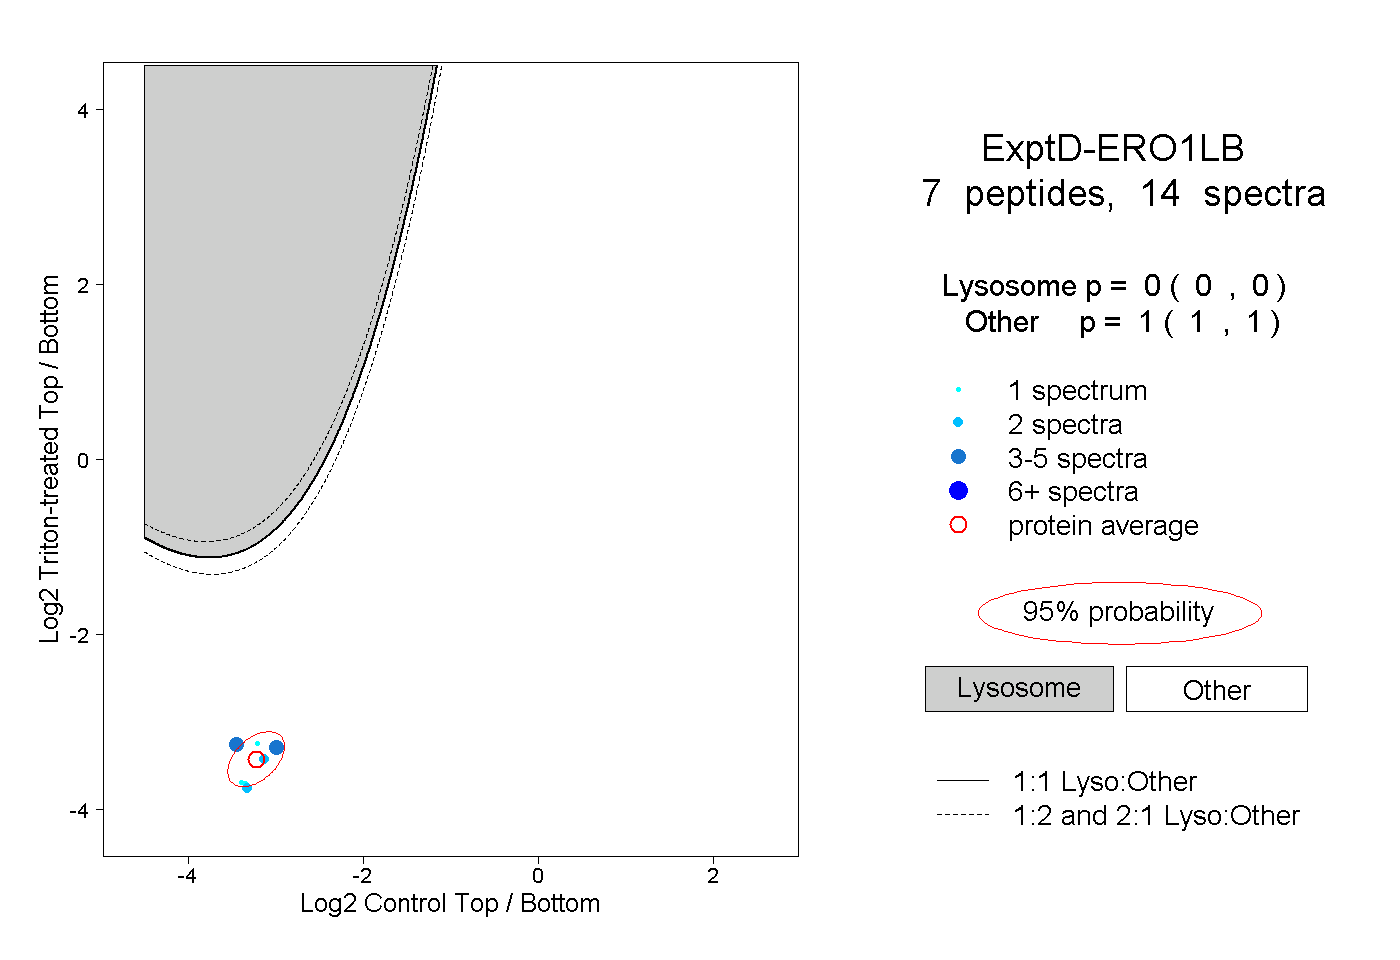 |
0.000 0.000 | 0.000 |
1.000 1.000 | 1.000 |