 7
7peptides
spectra
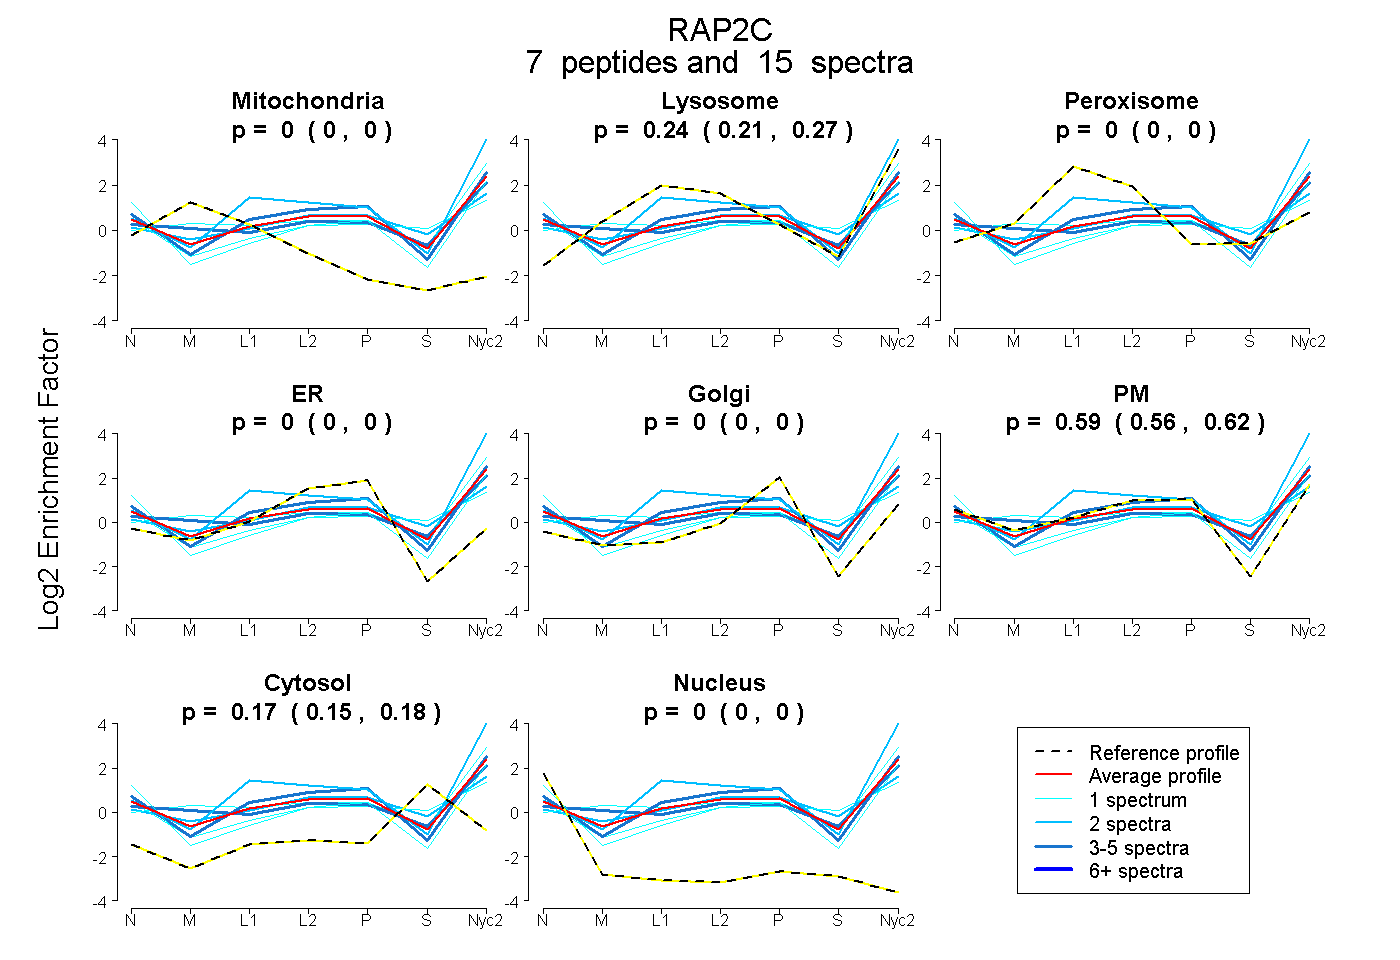
0.000 | 0.000
0.210 | 0.269
0.000 | 0.000
0.000 | 0.000
0.000 | 0.000
0.562 | 0.616
0.149 | 0.182
0.000 | 0.000
1peptide
spectra
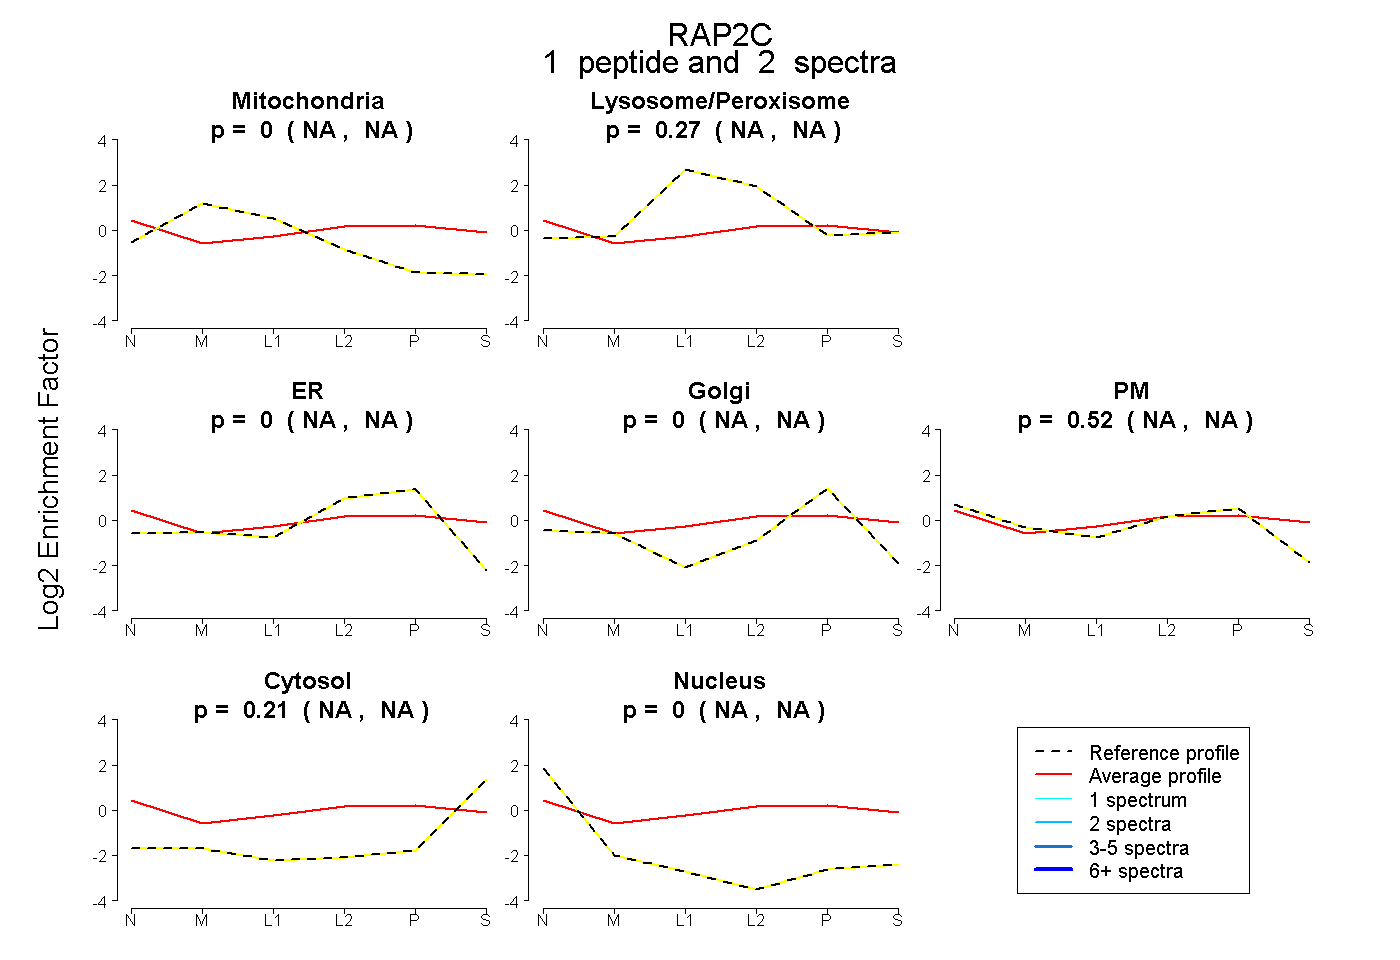
NA | NA
NA | NA
NA | NA
NA | NA
NA | NA
NA | NA
NA | NA
3peptides
spectra
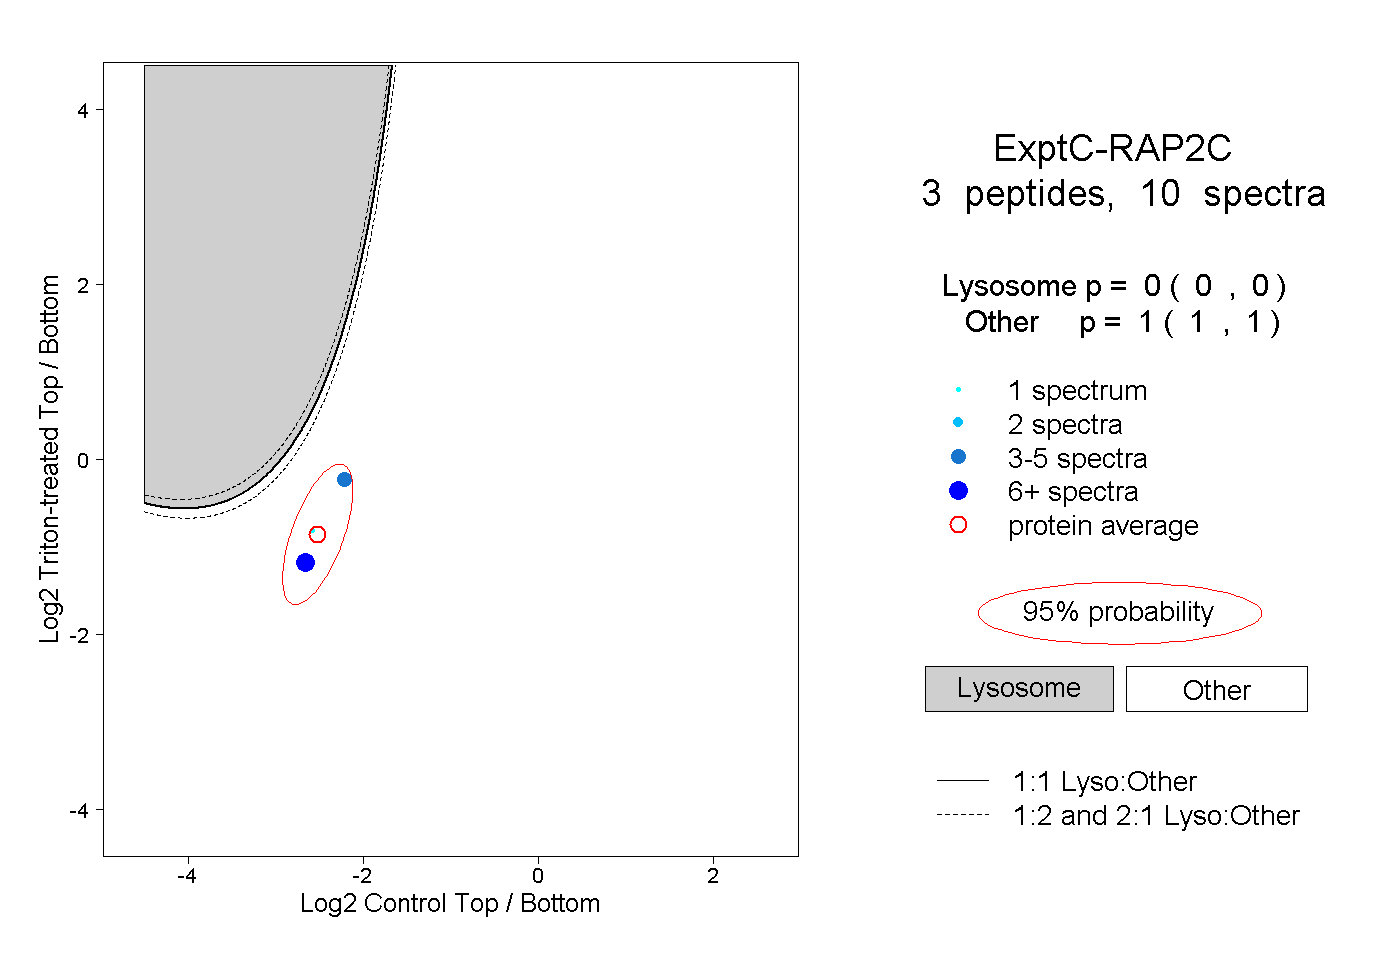
0.000 | 0.000
1.000 | 1.000
1peptide
spectrum
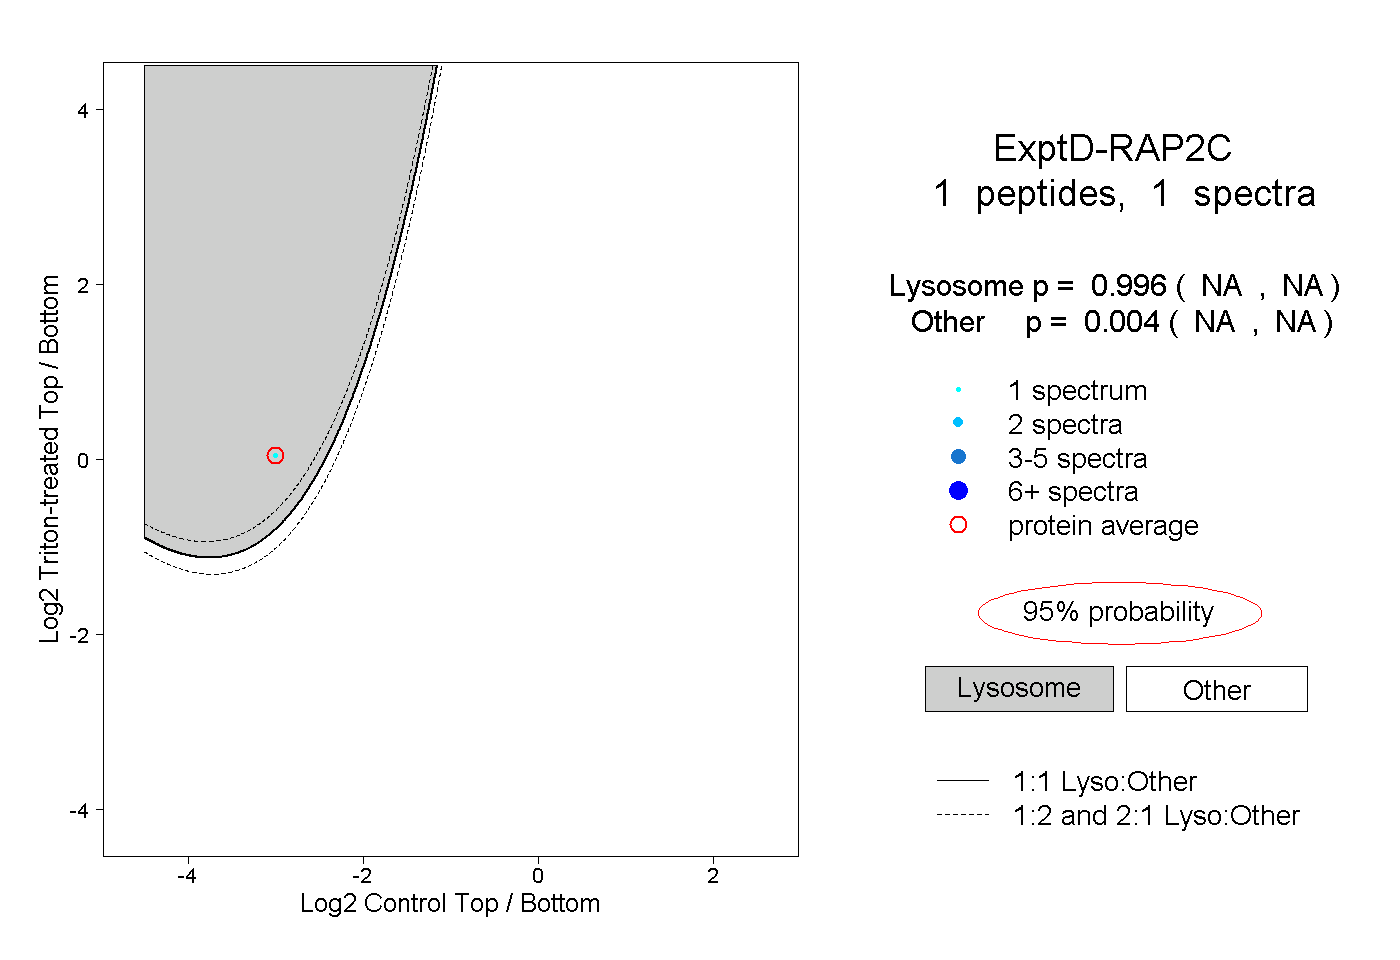
NA | NA
NA | NA