 7
7peptides
spectra
0.000 | 0.000
0.210 | 0.269
0.000 | 0.000
0.000 | 0.000
0.000 | 0.000
0.562 | 0.616
0.149 | 0.182
0.000 | 0.000
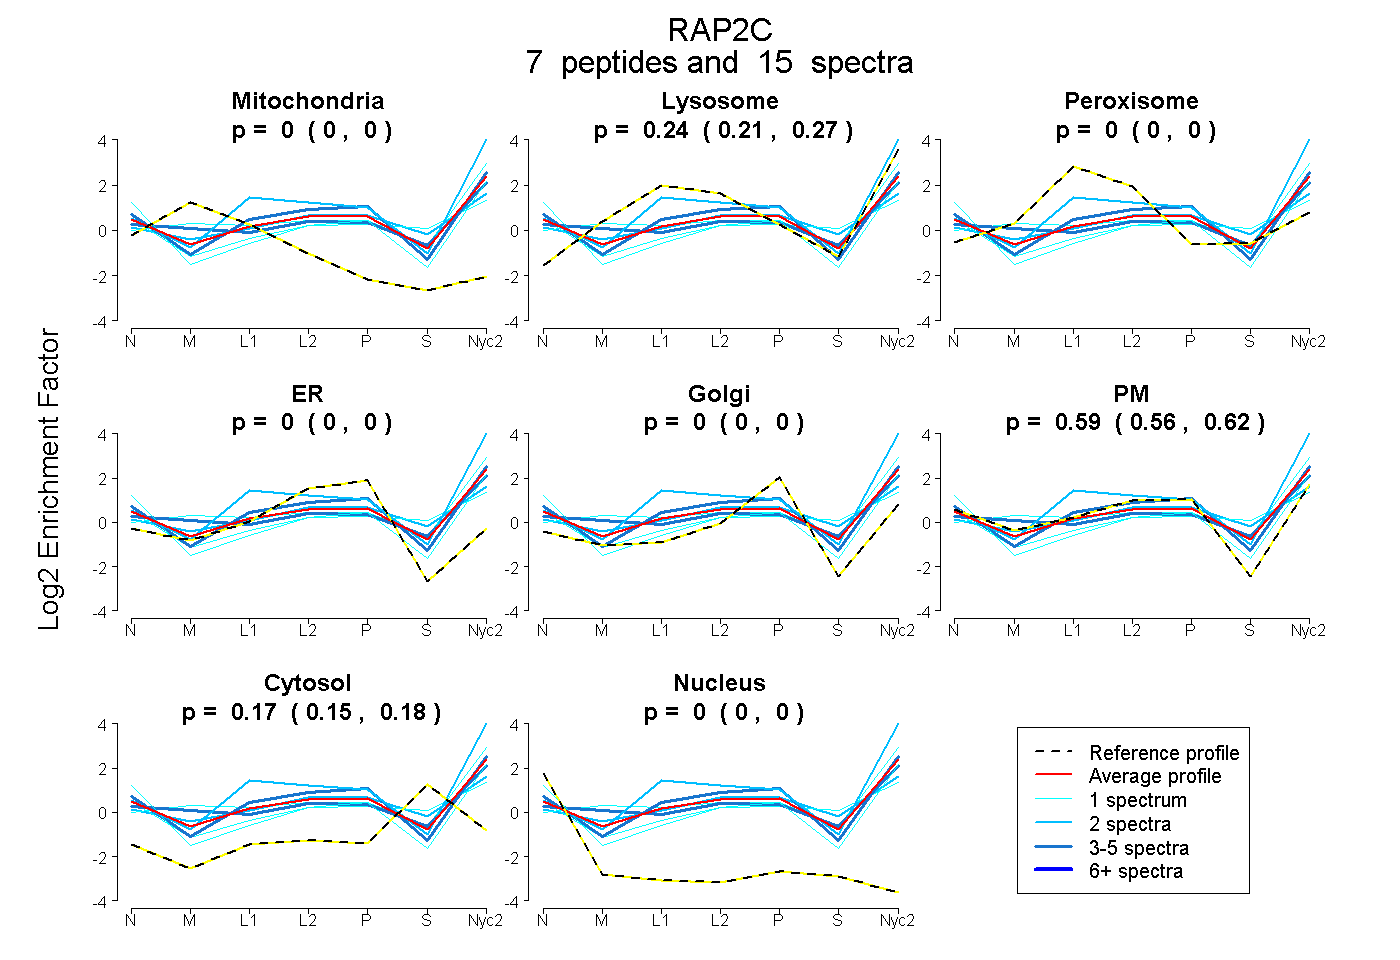
| Plot | Mito | Lyso | Perox | ER | Golgi | PM | Cytosol | Nucleus | |||||
| Expt A |
7 peptides |
15 spectra |
|
0.000 0.000 | 0.000 |
0.241 0.210 | 0.269 |
0.000 0.000 | 0.000 |
0.000 0.000 | 0.000 |
0.000 0.000 | 0.000 |
0.592 0.562 | 0.616 |
0.167 0.149 | 0.182 |
0.000 0.000 | 0.000 |
| 1 spectrum, VPLILVGNK | 0.000 | 0.000 | 0.000 | 0.000 | 0.000 | 0.820 | 0.137 | 0.043 | ||
| 3 spectra, VDLEPER | 0.000 | 0.258 | 0.000 | 0.000 | 0.000 | 0.535 | 0.207 | 0.000 | ||
| 2 spectra, ALAQEWGCPFMETSAK | 0.000 | 0.228 | 0.031 | 0.000 | 0.000 | 0.479 | 0.263 | 0.000 | ||
| 2 spectra, YDPTIEDFYR | 0.000 | 0.578 | 0.000 | 0.000 | 0.000 | 0.422 | 0.000 | 0.000 | ||
| 1 spectrum, SALTVQFVTGTFIEK | 0.000 | 0.453 | 0.000 | 0.000 | 0.000 | 0.410 | 0.137 | 0.000 | ||
| 5 spectra, SMVDELFAEIVR | 0.000 | 0.180 | 0.000 | 0.000 | 0.000 | 0.746 | 0.074 | 0.000 | ||
| 1 spectrum, EVMSSEGR | 0.000 | 0.084 | 0.000 | 0.000 | 0.000 | 0.526 | 0.390 | 0.000 |
| Plot | Mito | Lyso or Perox | ER | Golgi | PM | Cytosol | Nucleus | ||||||
| Expt B |
1 peptide |
2 spectra |
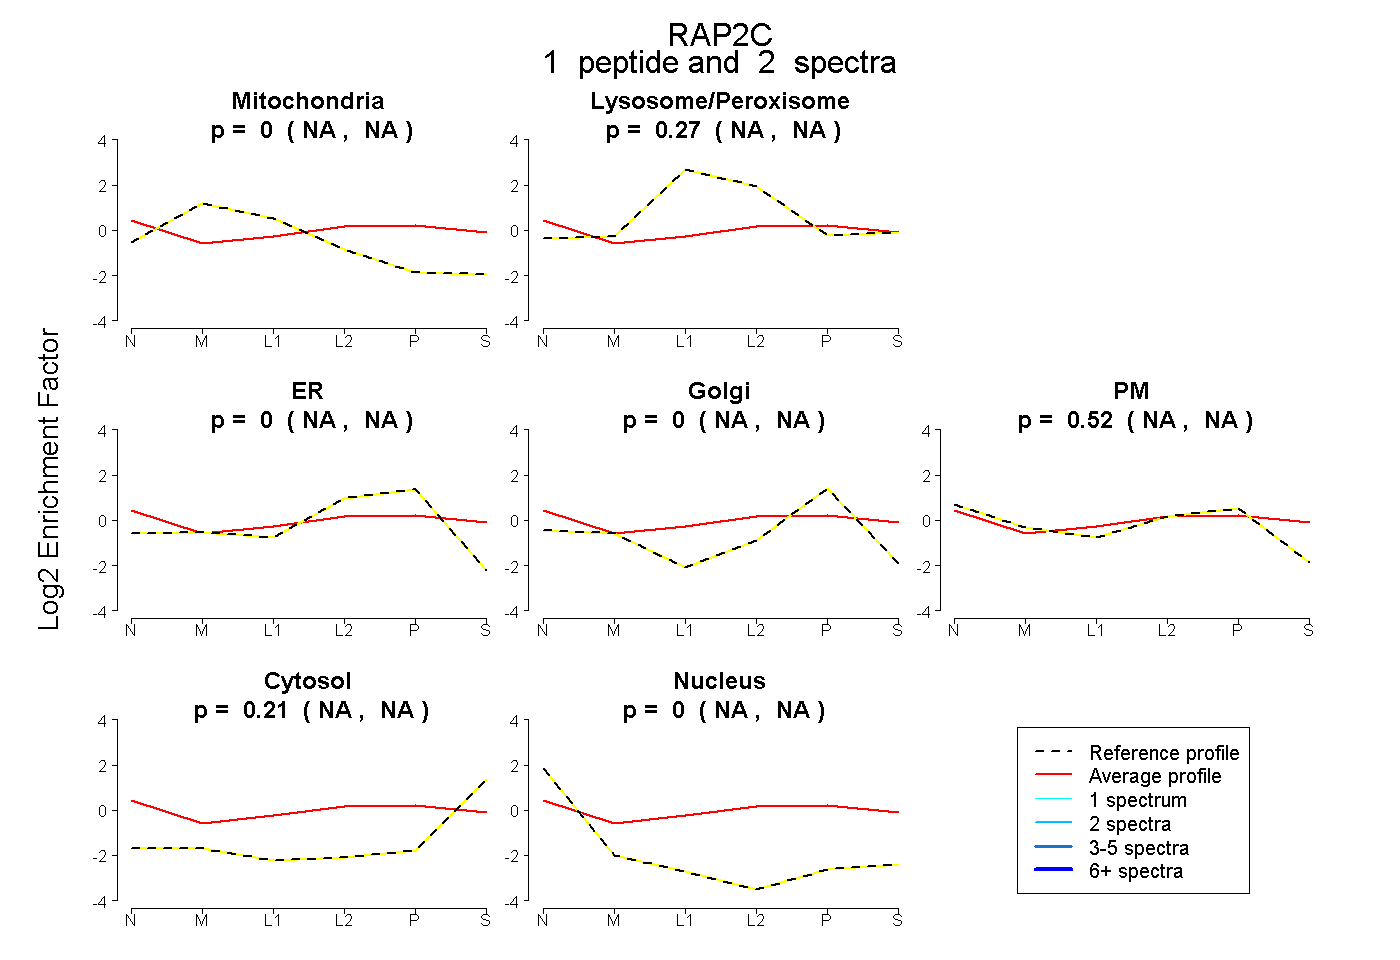 |
0.000 NA | NA |
0.265 NA | NA |
0.000 NA | NA |
0.000 NA | NA |
0.523 NA | NA |
0.212 NA | NA |
0.000 NA | NA |
|||
| Plot | Lyso | Other | |||||||||||
| Expt C |
3 peptides |
10 spectra |
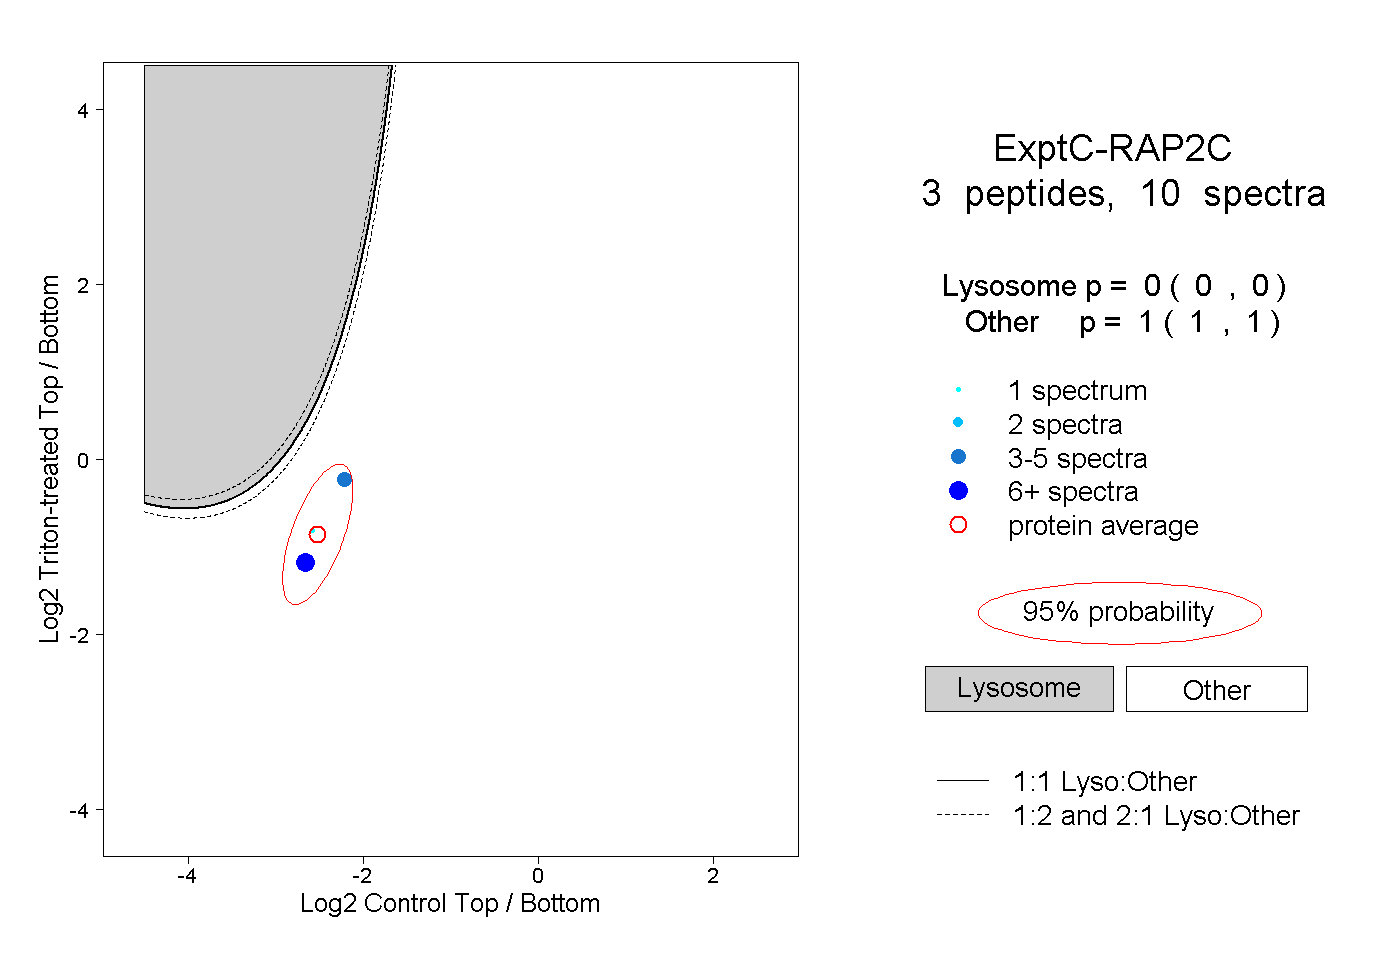 |
0.000 0.000 | 0.000 |
1.000 1.000 | 1.000 |
||||||||
| Plot | Lyso | Other | |||||||||||
| Expt D |
1 peptide |
1 spectrum |
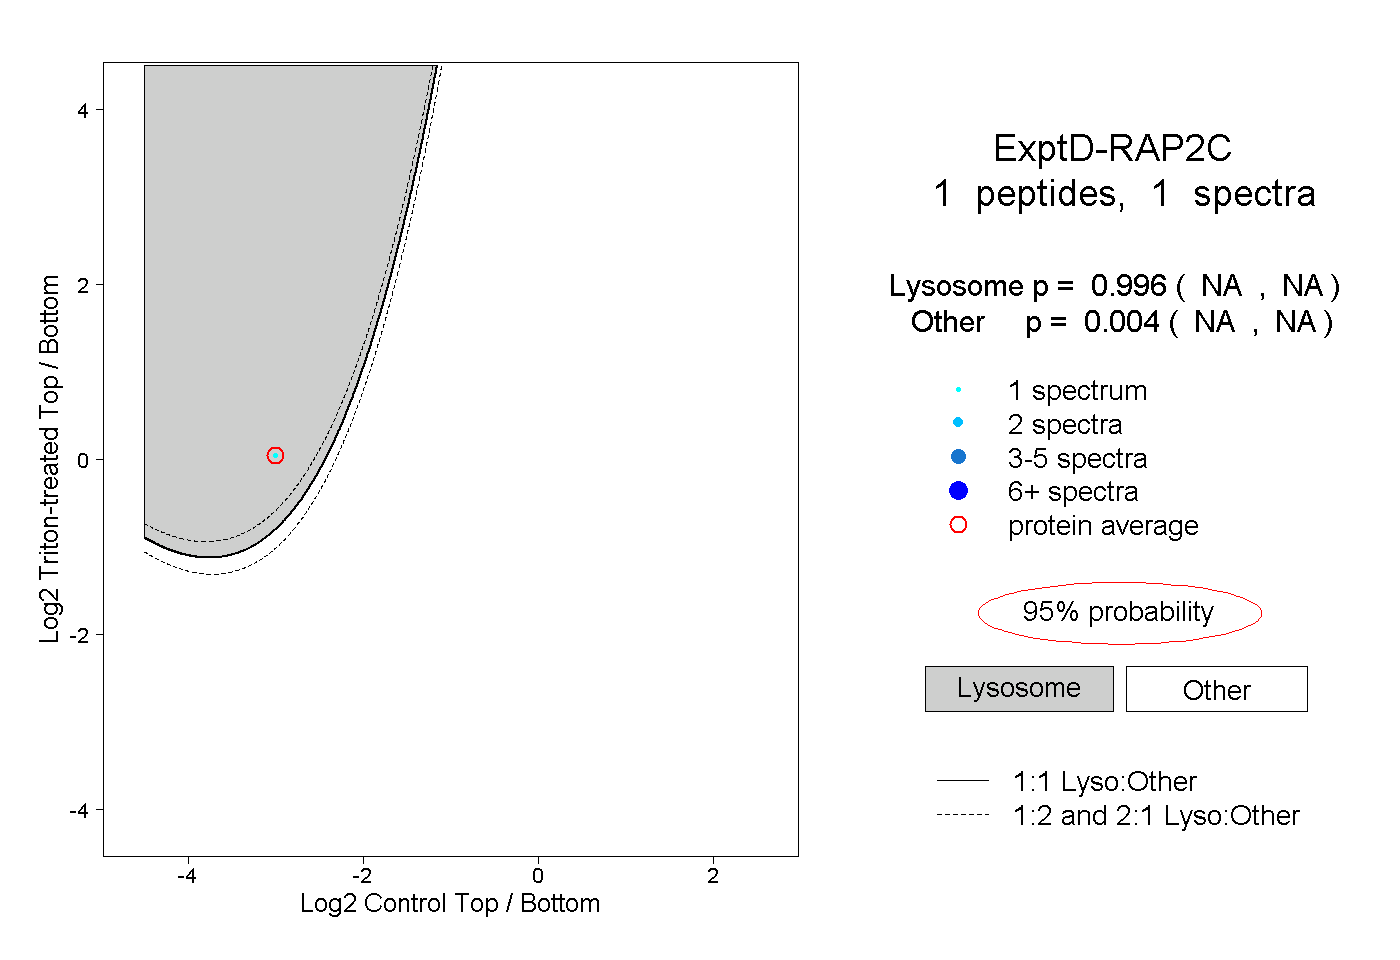 |
0.996 NA | NA |
0.004 NA | NA |