 3
3peptides
spectra
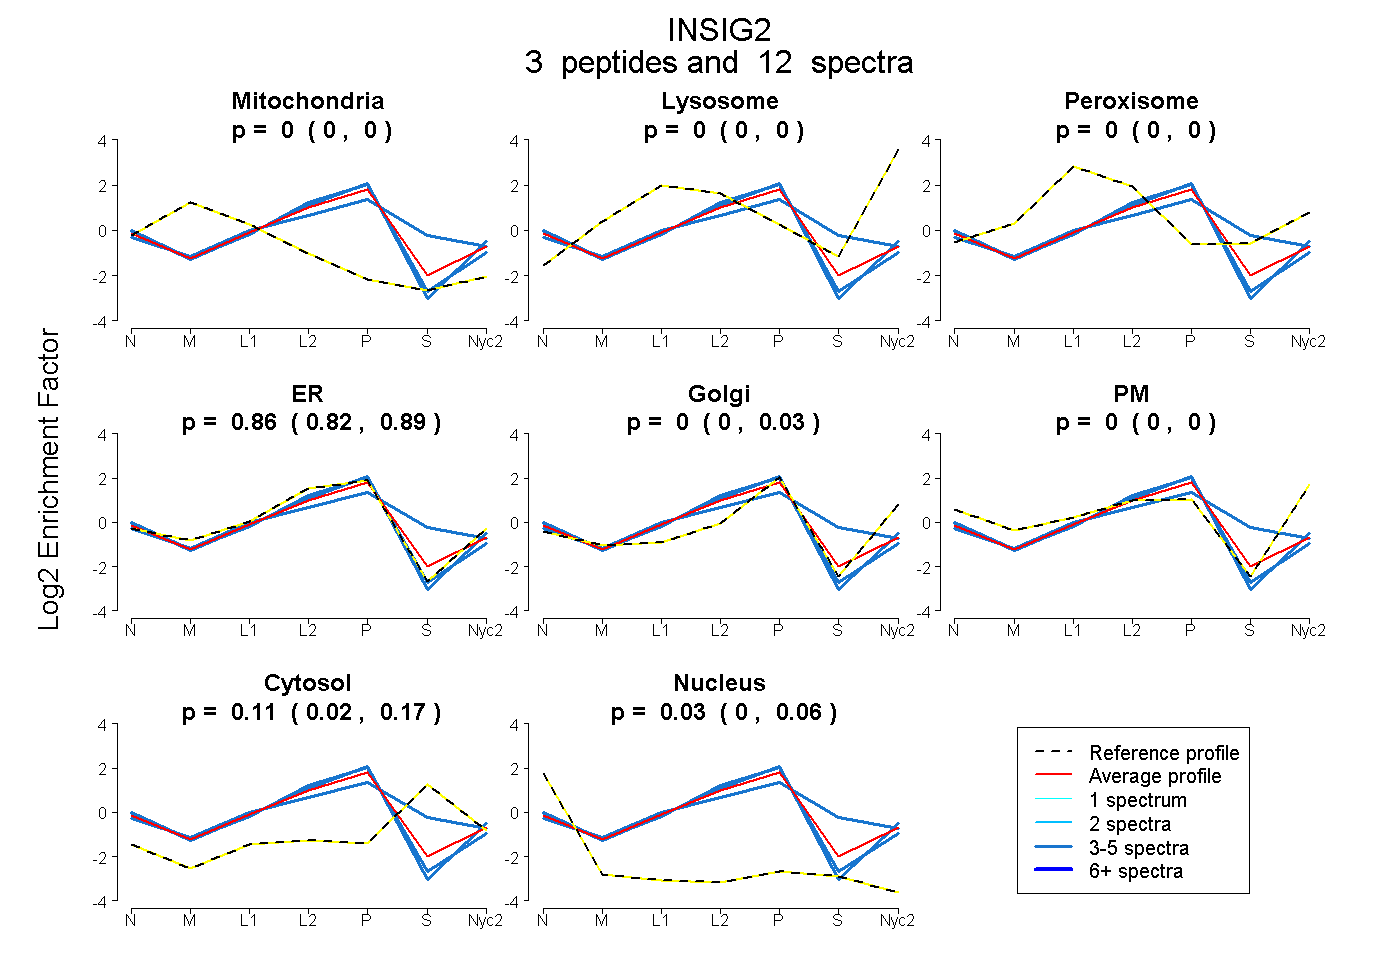
0.000 | 0.000
0.000 | 0.000
0.000 | 0.000
0.817 | 0.888
0.000 | 0.030
0.000 | 0.000
0.015 | 0.174
0.000 | 0.063
2peptides
spectra
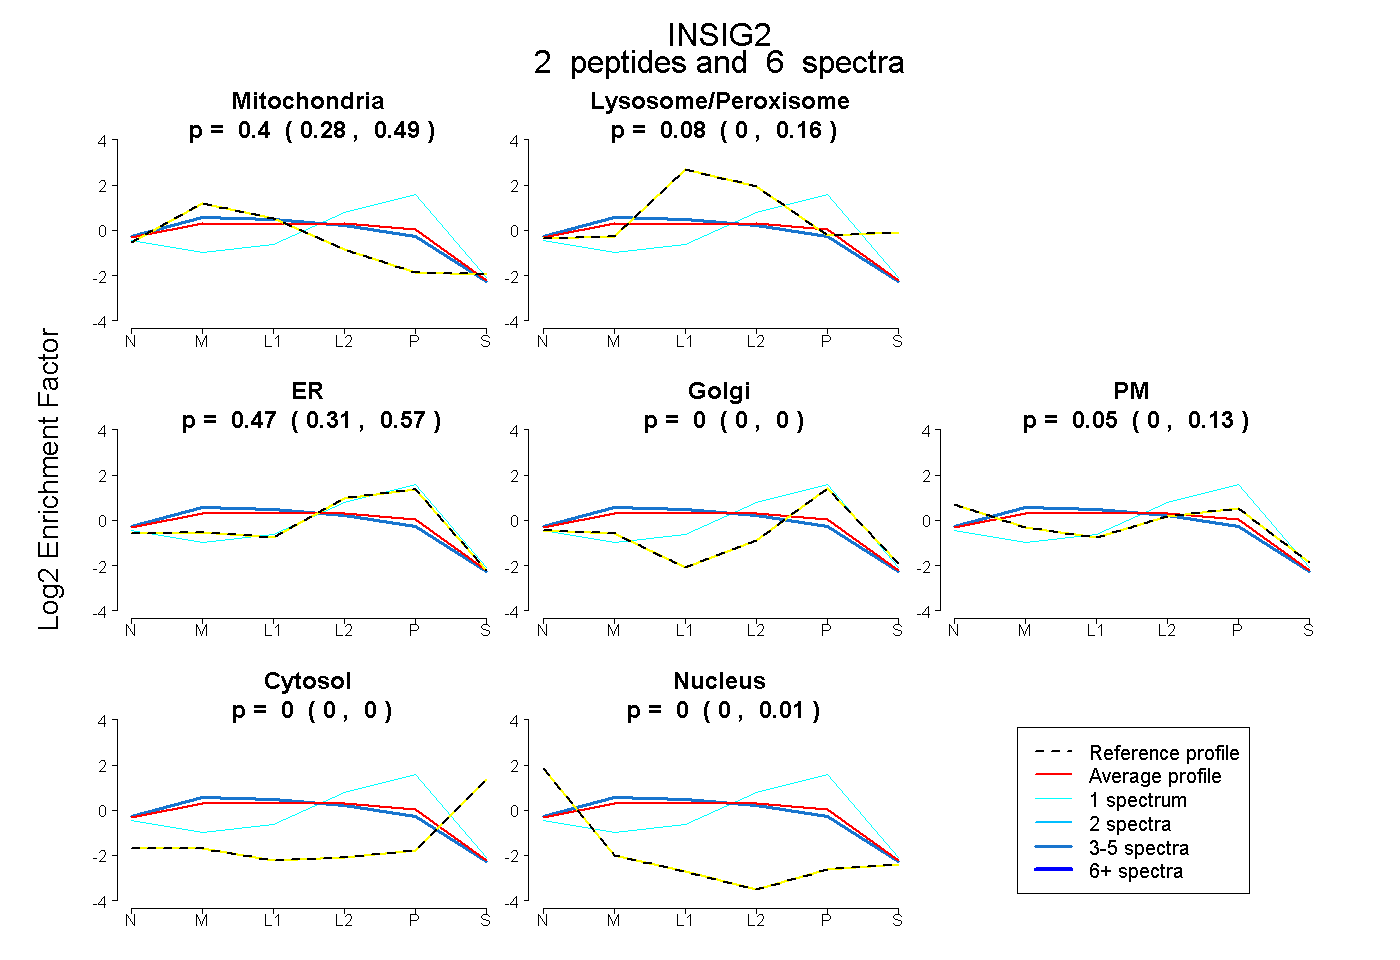
0.277 | 0.489
0.000 | 0.164
0.307 | 0.572
0.000 | 0.000
0.000 | 0.132
0.000 | 0.000
0.000 | 0.014
2peptides
spectra
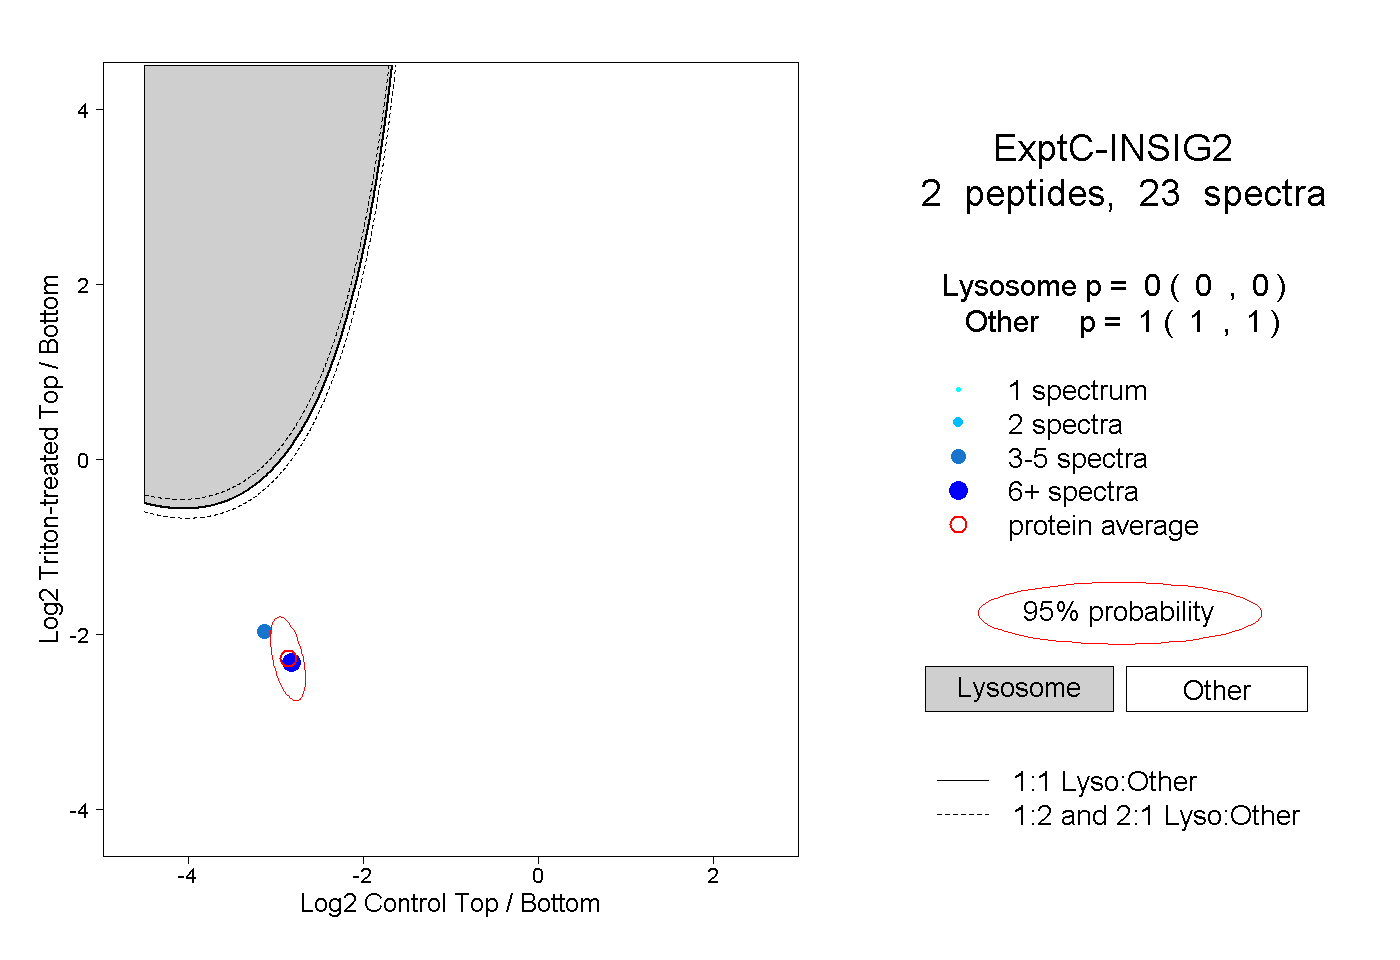
0.000 | 0.000
1.000 | 1.000