 3
3peptides
spectra
0.000 | 0.000
0.000 | 0.000
0.000 | 0.000
0.817 | 0.888
0.000 | 0.030
0.000 | 0.000
0.015 | 0.174
0.000 | 0.063
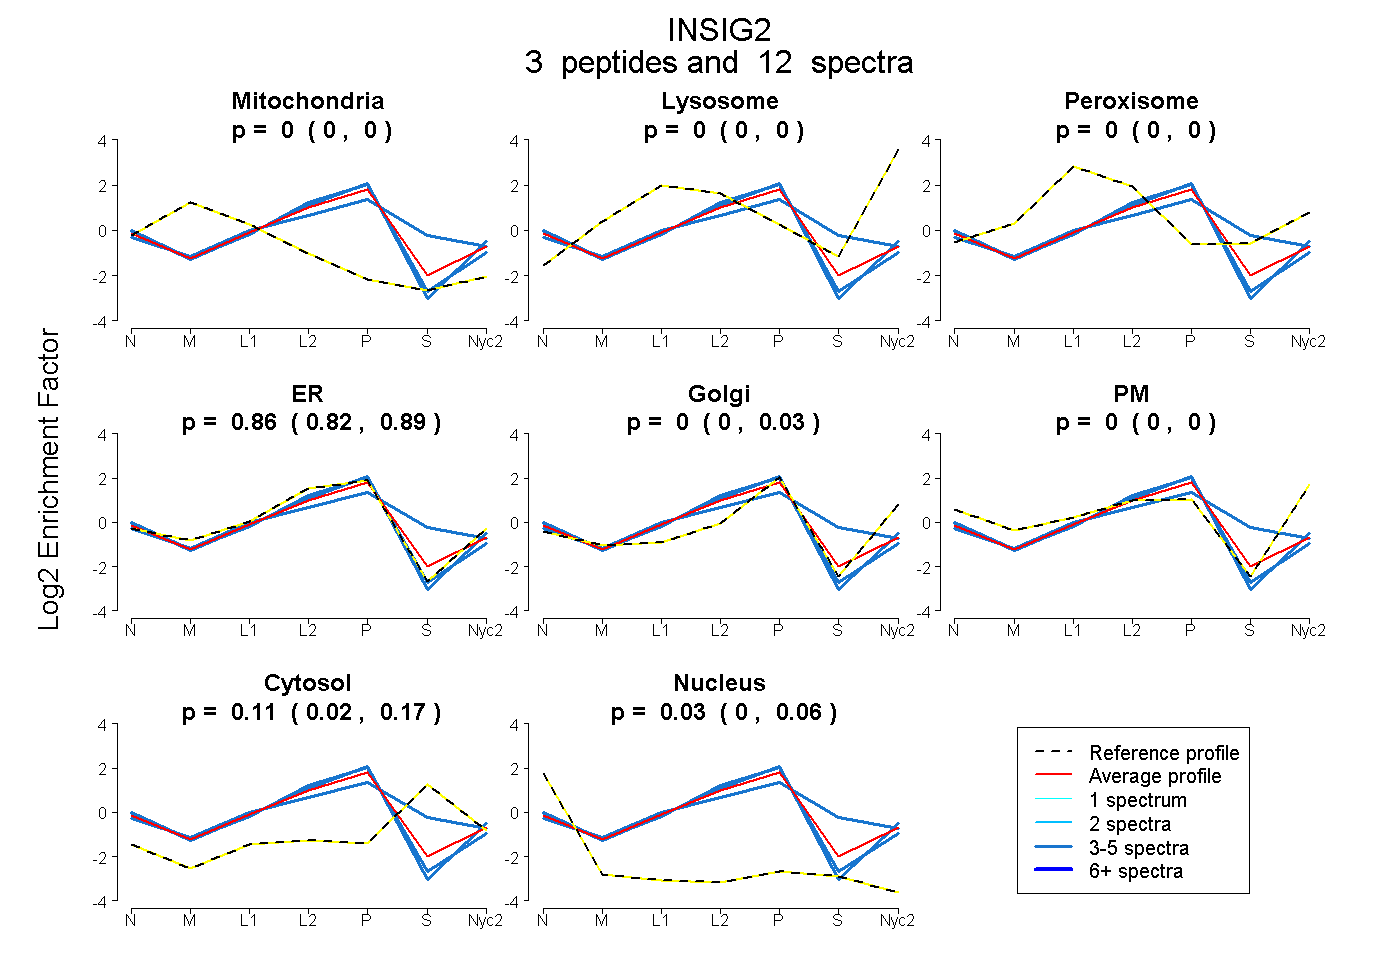
| Plot | Mito | Lyso | Perox | ER | Golgi | PM | Cytosol | Nucleus | |||||
| Expt A |
3 peptides |
12 spectra |
|
0.000 0.000 | 0.000 |
0.000 0.000 | 0.000 |
0.000 0.000 | 0.000 |
0.862 0.817 | 0.888 |
0.000 0.000 | 0.030 |
0.000 0.000 | 0.000 |
0.109 0.015 | 0.174 |
0.029 0.000 | 0.063 |
| 5 spectra, HLGEPHK | 0.000 | 0.000 | 0.000 | 0.873 | 0.076 | 0.000 | 0.000 | 0.052 | ||
| 4 spectra, QLAMYECK | 0.000 | 0.000 | 0.097 | 0.568 | 0.000 | 0.000 | 0.336 | 0.000 | ||
| 3 spectra, AEGETESPRPK | 0.000 | 0.000 | 0.000 | 0.923 | 0.000 | 0.000 | 0.000 | 0.077 |
| Plot | Mito | Lyso or Perox | ER | Golgi | PM | Cytosol | Nucleus | ||||||
| Expt B |
2 peptides |
6 spectra |
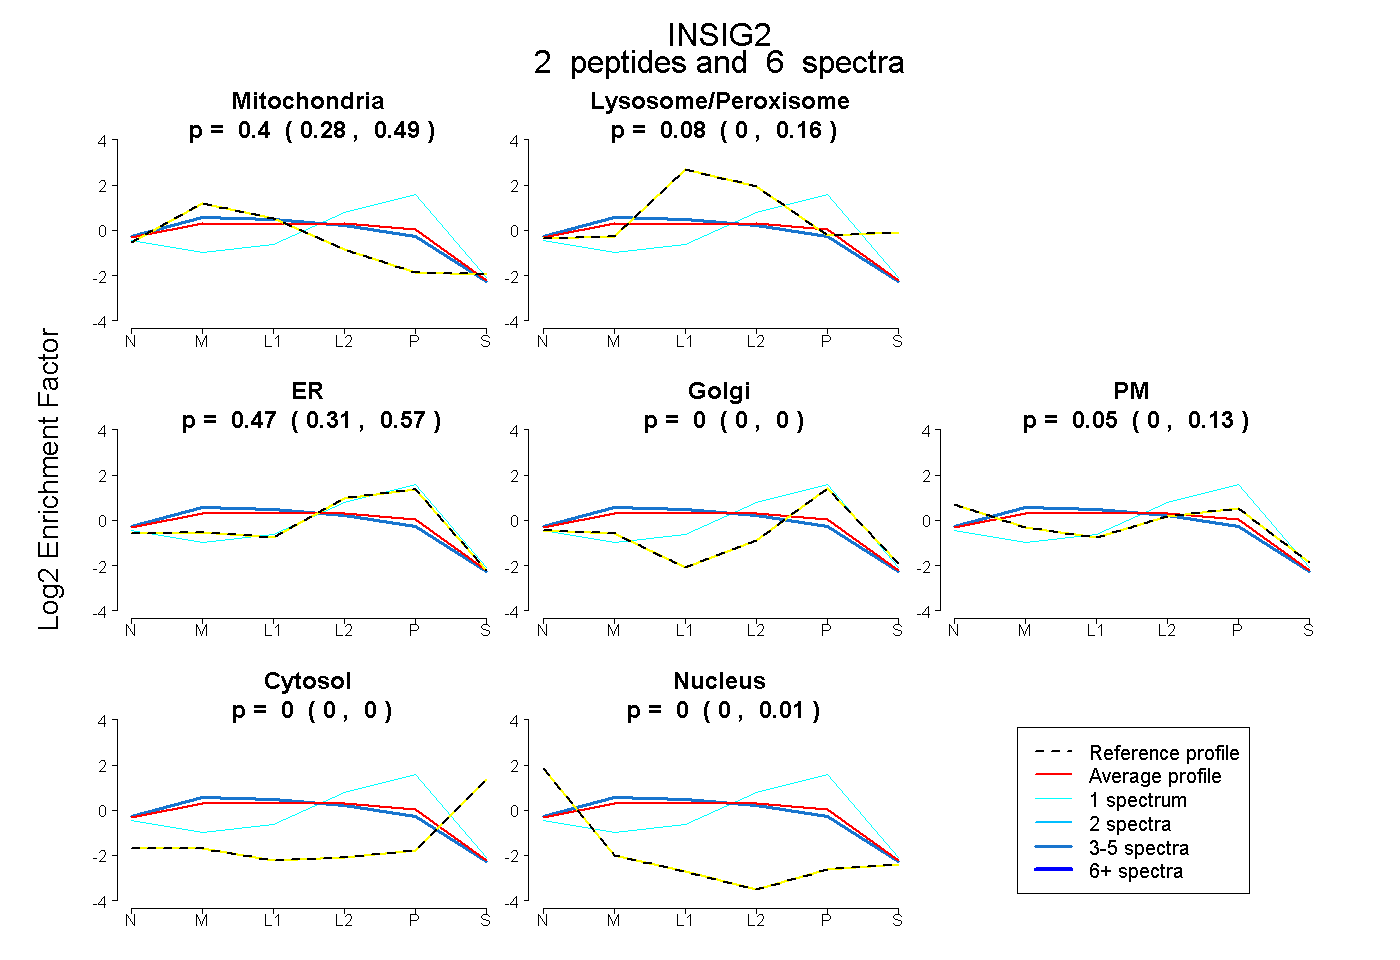 |
0.395 0.277 | 0.489 |
0.084 0.000 | 0.164 |
0.467 0.307 | 0.572 |
0.000 0.000 | 0.000 |
0.053 0.000 | 0.132 |
0.000 0.000 | 0.000 |
0.000 0.000 | 0.014 |
|||
| Plot | Lyso | Other | |||||||||||
| Expt C |
2 peptides |
23 spectra |
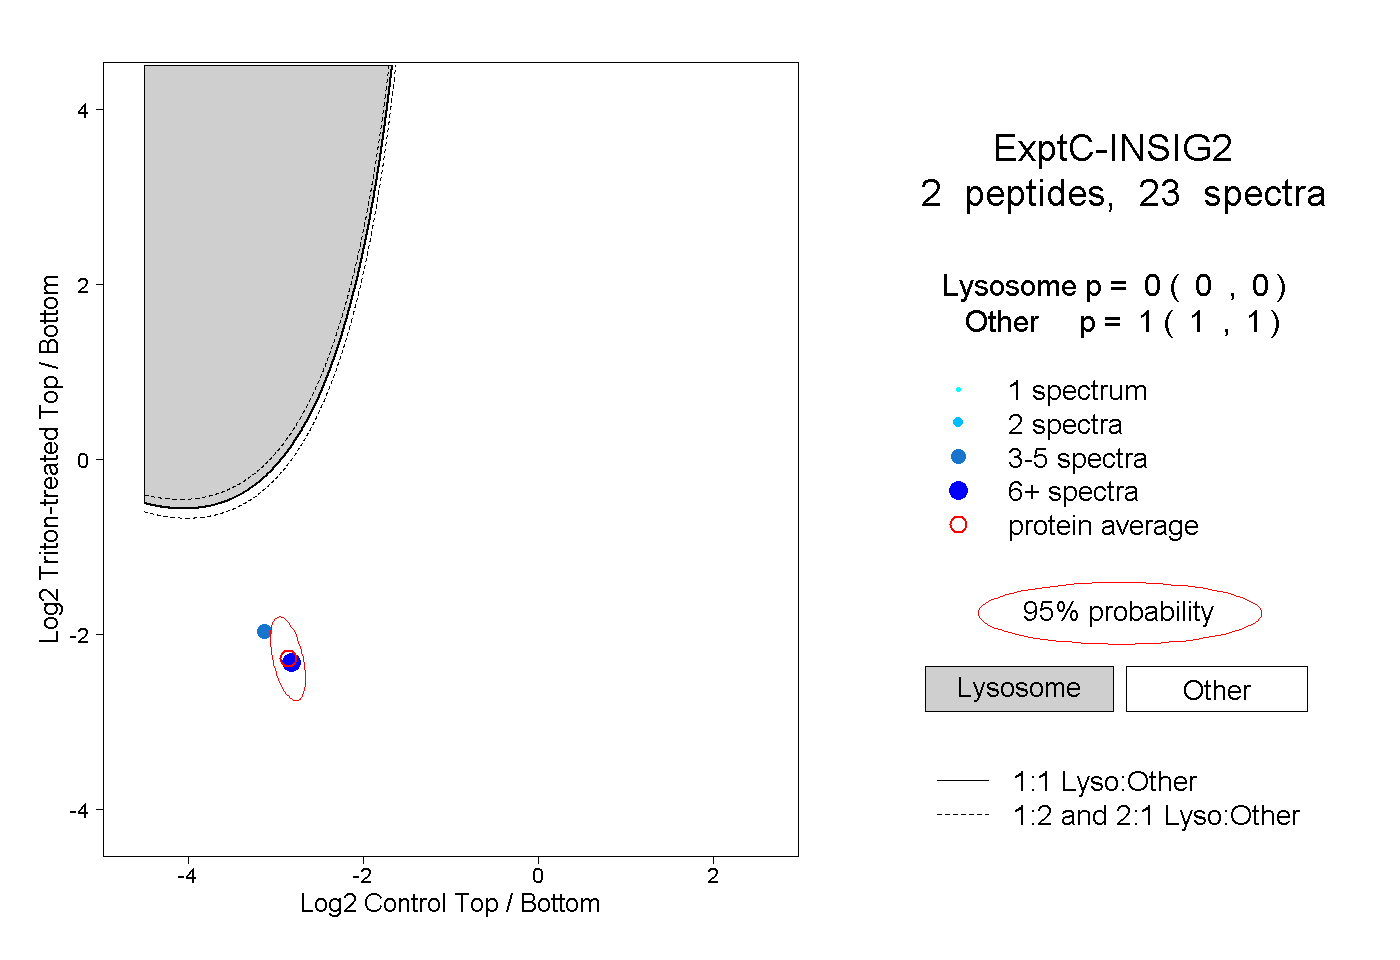 |
0.000 0.000 | 0.000 |
1.000 1.000 | 1.000 |