 11
11peptides
spectra
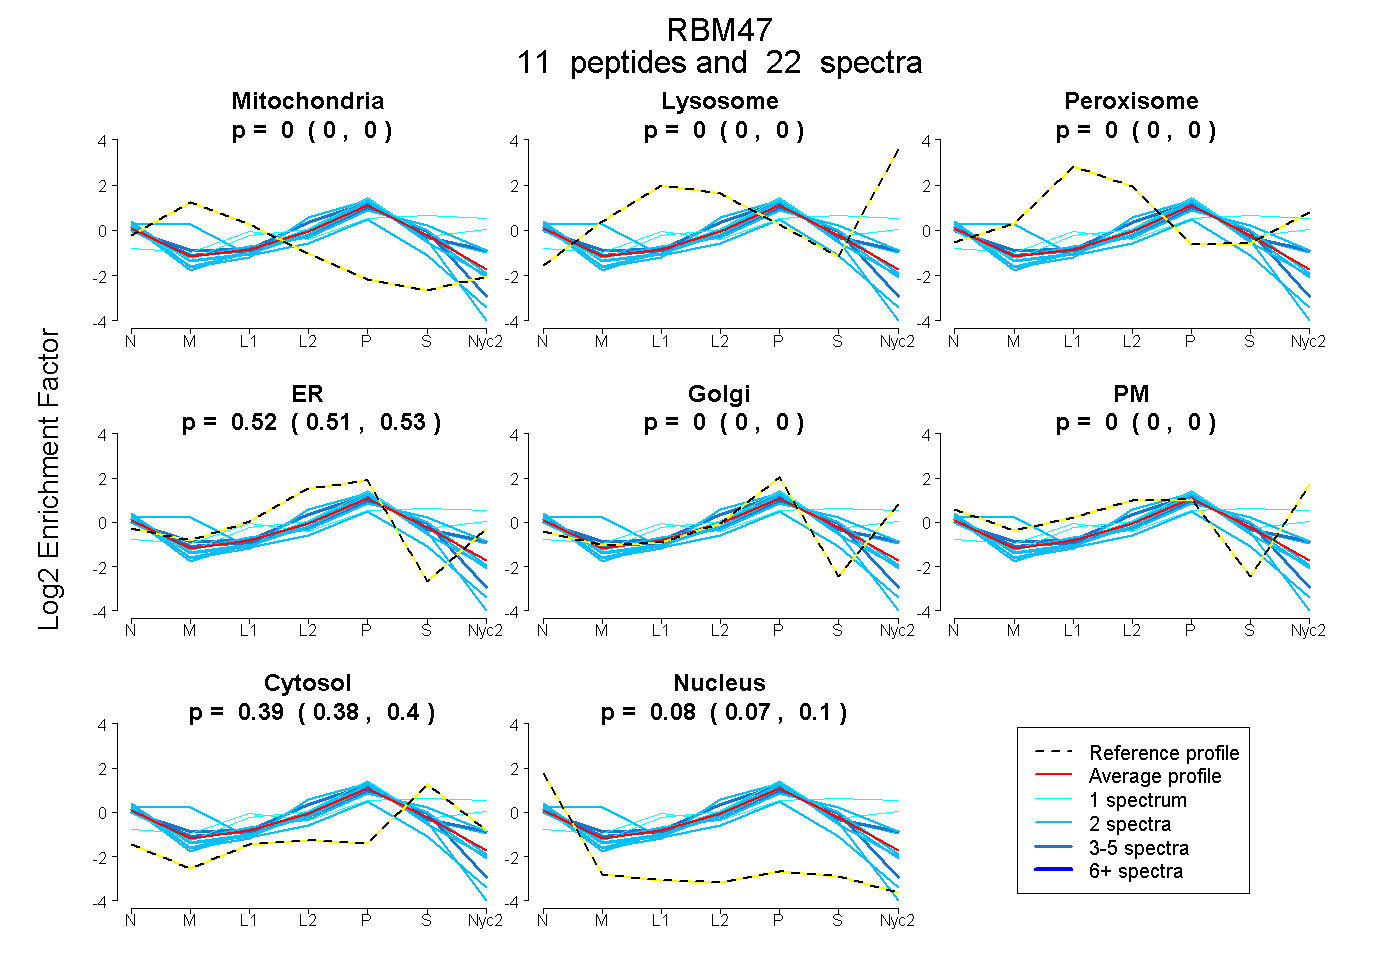
0.000 | 0.000
0.000 | 0.000
0.000 | 0.000
0.513 | 0.529
0.000 | 0.000
0.000 | 0.000
0.379 | 0.404
0.071 | 0.097
4peptides
spectra
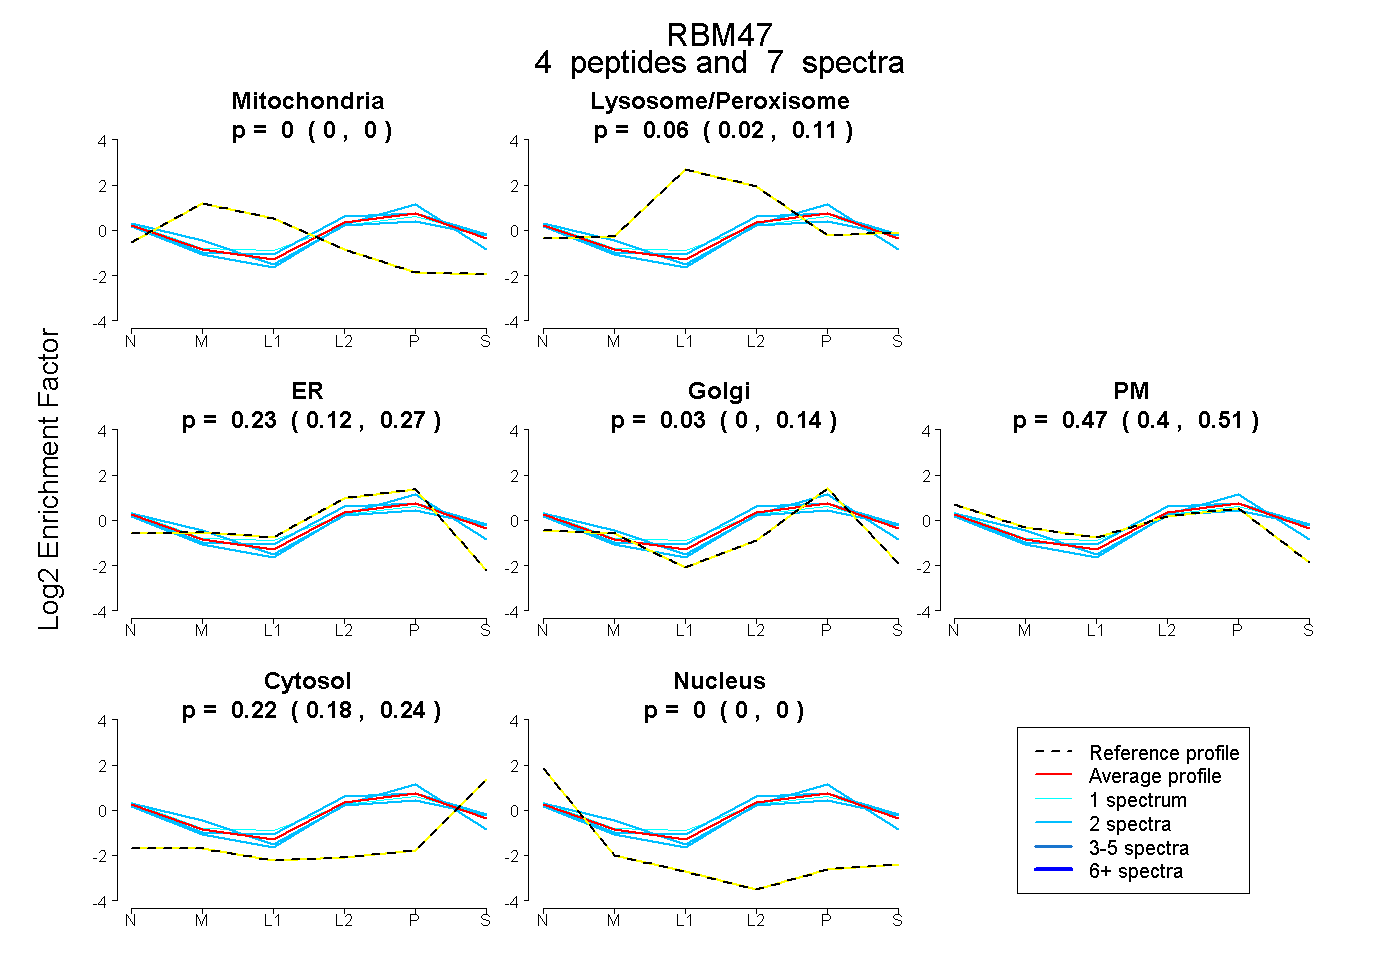
0.000 | 0.000
0.023 | 0.107
0.119 | 0.272
0.000 | 0.140
0.397 | 0.505
0.177 | 0.237
0.000 | 0.000
5peptides
spectra
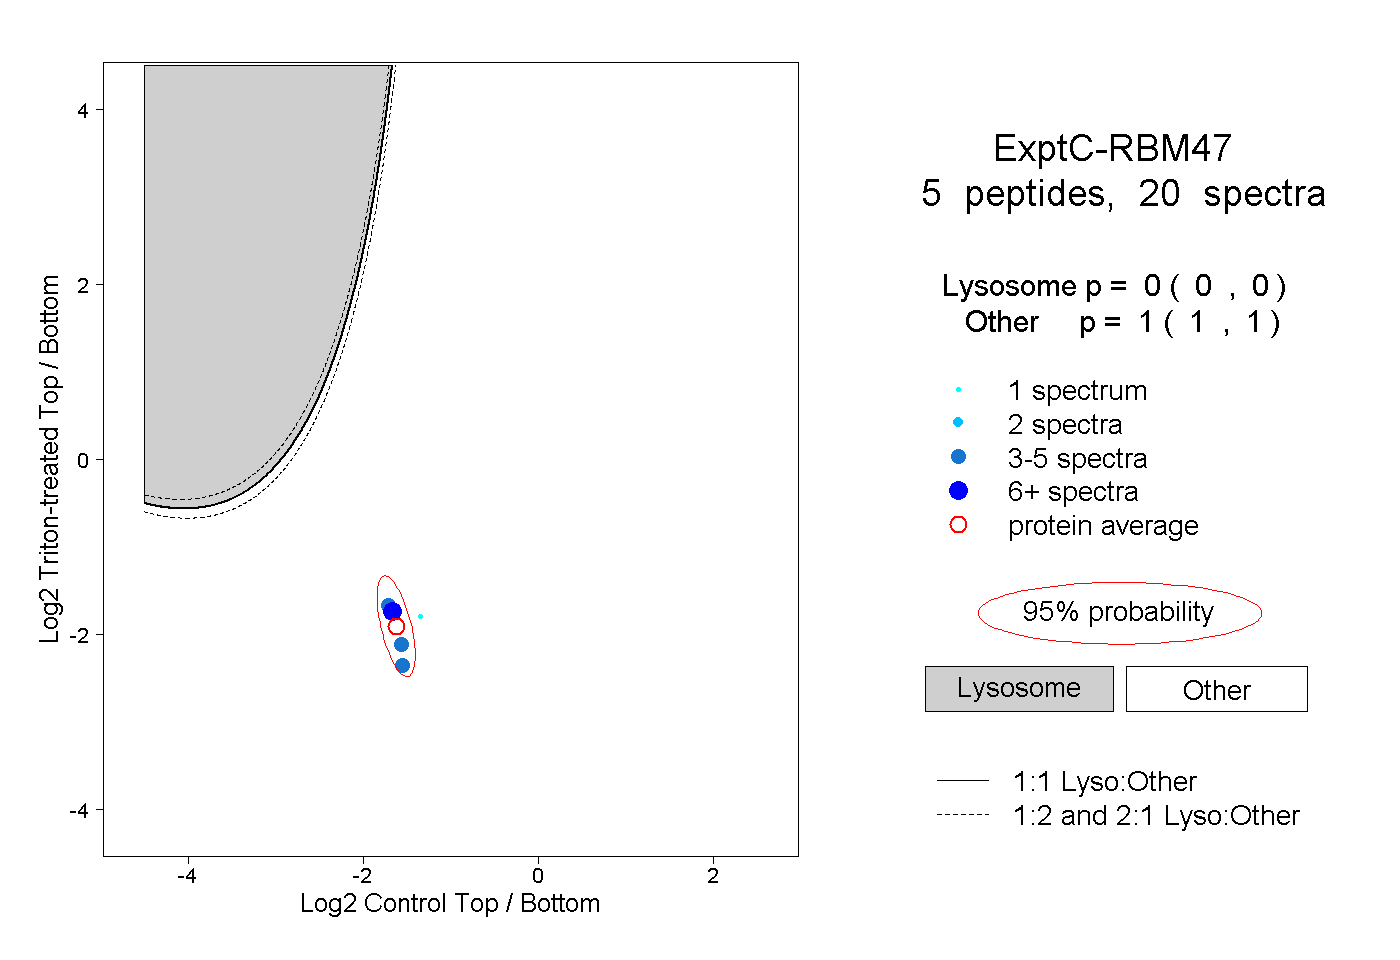
0.000 | 0.000
1.000 | 1.000
3peptides
spectra
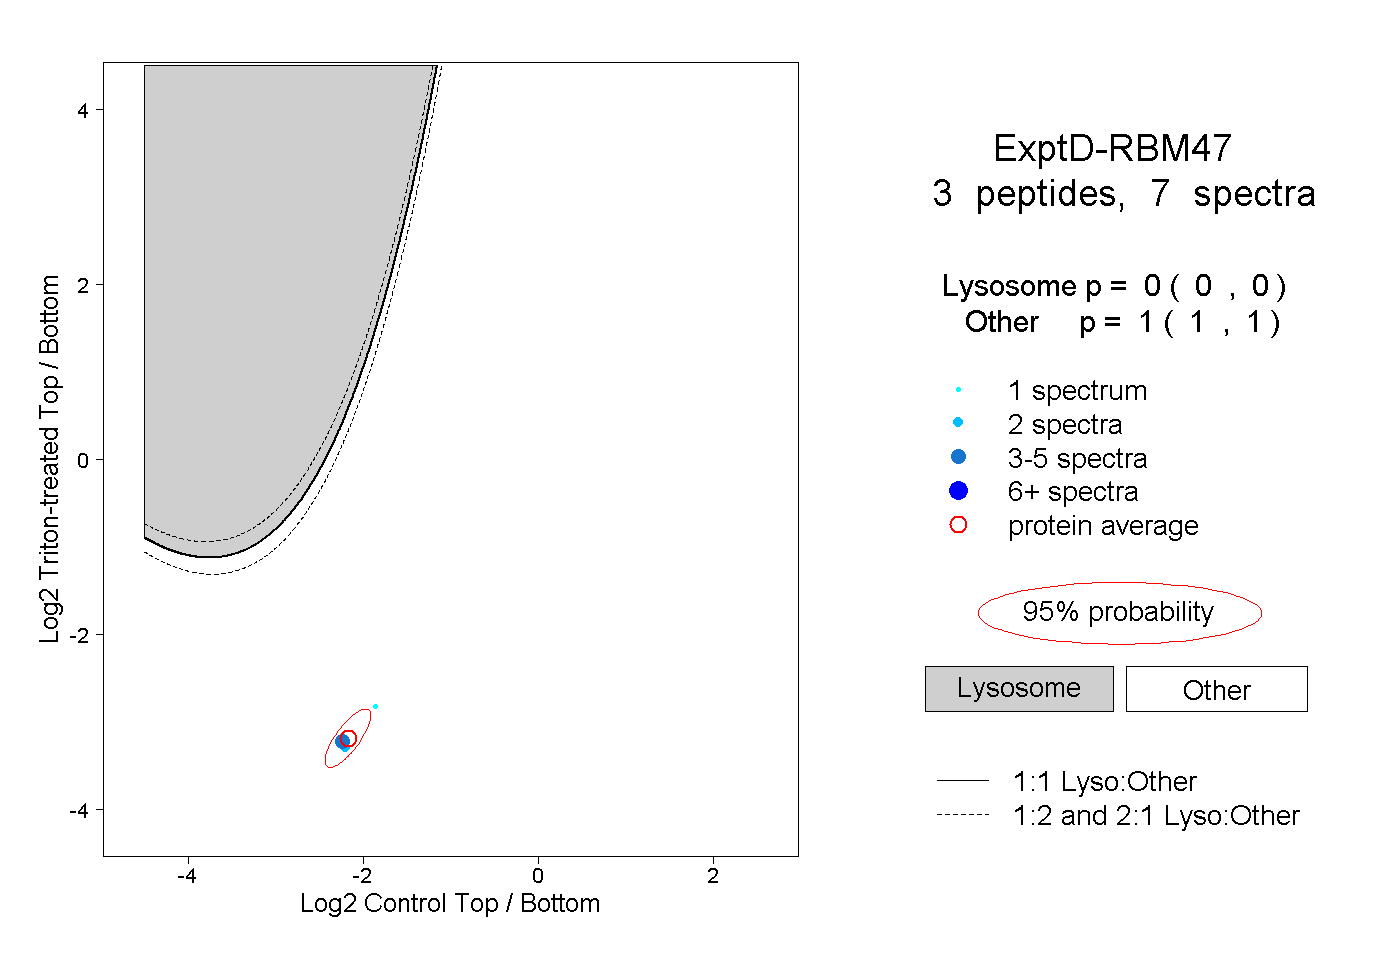
0.000 | 0.000
1.000 | 1.000