 11
11peptides
spectra
0.000 | 0.000
0.000 | 0.000
0.000 | 0.000
0.513 | 0.529
0.000 | 0.000
0.000 | 0.000
0.379 | 0.404
0.071 | 0.097
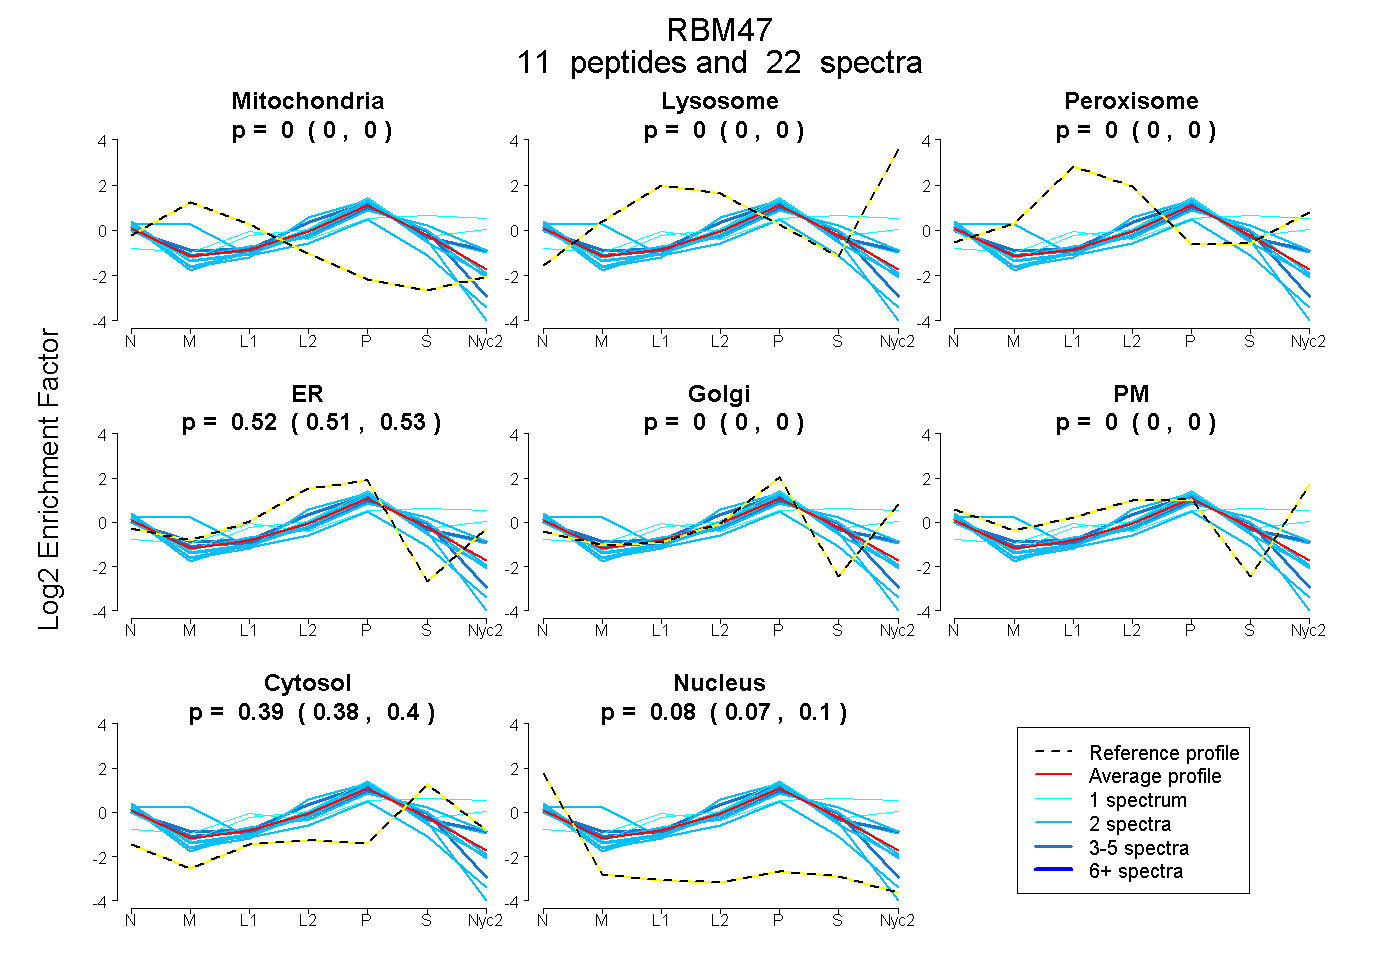
| Plot | Mito | Lyso | Perox | ER | Golgi | PM | Cytosol | Nucleus | |||||
| Expt A |
11 peptides |
22 spectra |
|
0.000 0.000 | 0.000 |
0.000 0.000 | 0.000 |
0.000 0.000 | 0.000 |
0.522 0.513 | 0.529 |
0.000 0.000 | 0.000 |
0.000 0.000 | 0.000 |
0.393 0.379 | 0.404 |
0.085 0.071 | 0.097 |
| 2 spectra, NLMIETTEETIK | 0.000 | 0.000 | 0.000 | 0.466 | 0.000 | 0.000 | 0.431 | 0.104 | ||
| 3 spectra, LMMDFDGK | 0.011 | 0.000 | 0.000 | 0.457 | 0.000 | 0.000 | 0.370 | 0.162 | ||
| 2 spectra, YGGPPPGWEGPHPQR | 0.000 | 0.000 | 0.009 | 0.395 | 0.081 | 0.000 | 0.515 | 0.001 | ||
| 1 spectrum, VTEGVLNVIVYASAADK | 0.000 | 0.000 | 0.135 | 0.149 | 0.420 | 0.000 | 0.297 | 0.000 | ||
| 2 spectra, GEILEEIAK | 0.000 | 0.000 | 0.000 | 0.466 | 0.106 | 0.000 | 0.389 | 0.039 | ||
| 2 spectra, SFGQFNPGCVER | 0.000 | 0.000 | 0.000 | 0.489 | 0.000 | 0.000 | 0.230 | 0.282 | ||
| 1 spectrum, LFIGGIPK | 0.000 | 0.165 | 0.133 | 0.000 | 0.231 | 0.000 | 0.471 | 0.000 | ||
| 2 spectra, ELNNYEIRPGR | 0.000 | 0.000 | 0.000 | 0.511 | 0.000 | 0.000 | 0.365 | 0.123 | ||
| 2 spectra, GCEVFVGK | 0.329 | 0.000 | 0.000 | 0.348 | 0.000 | 0.000 | 0.121 | 0.202 | ||
| 3 spectra, GYAFVMYCHK | 0.000 | 0.000 | 0.000 | 0.603 | 0.002 | 0.000 | 0.395 | 0.000 | ||
| 2 spectra, TGYNMVQENGQR | 0.000 | 0.000 | 0.000 | 0.582 | 0.000 | 0.000 | 0.288 | 0.130 |
| Plot | Mito | Lyso or Perox | ER | Golgi | PM | Cytosol | Nucleus | ||||||
| Expt B |
4 peptides |
7 spectra |
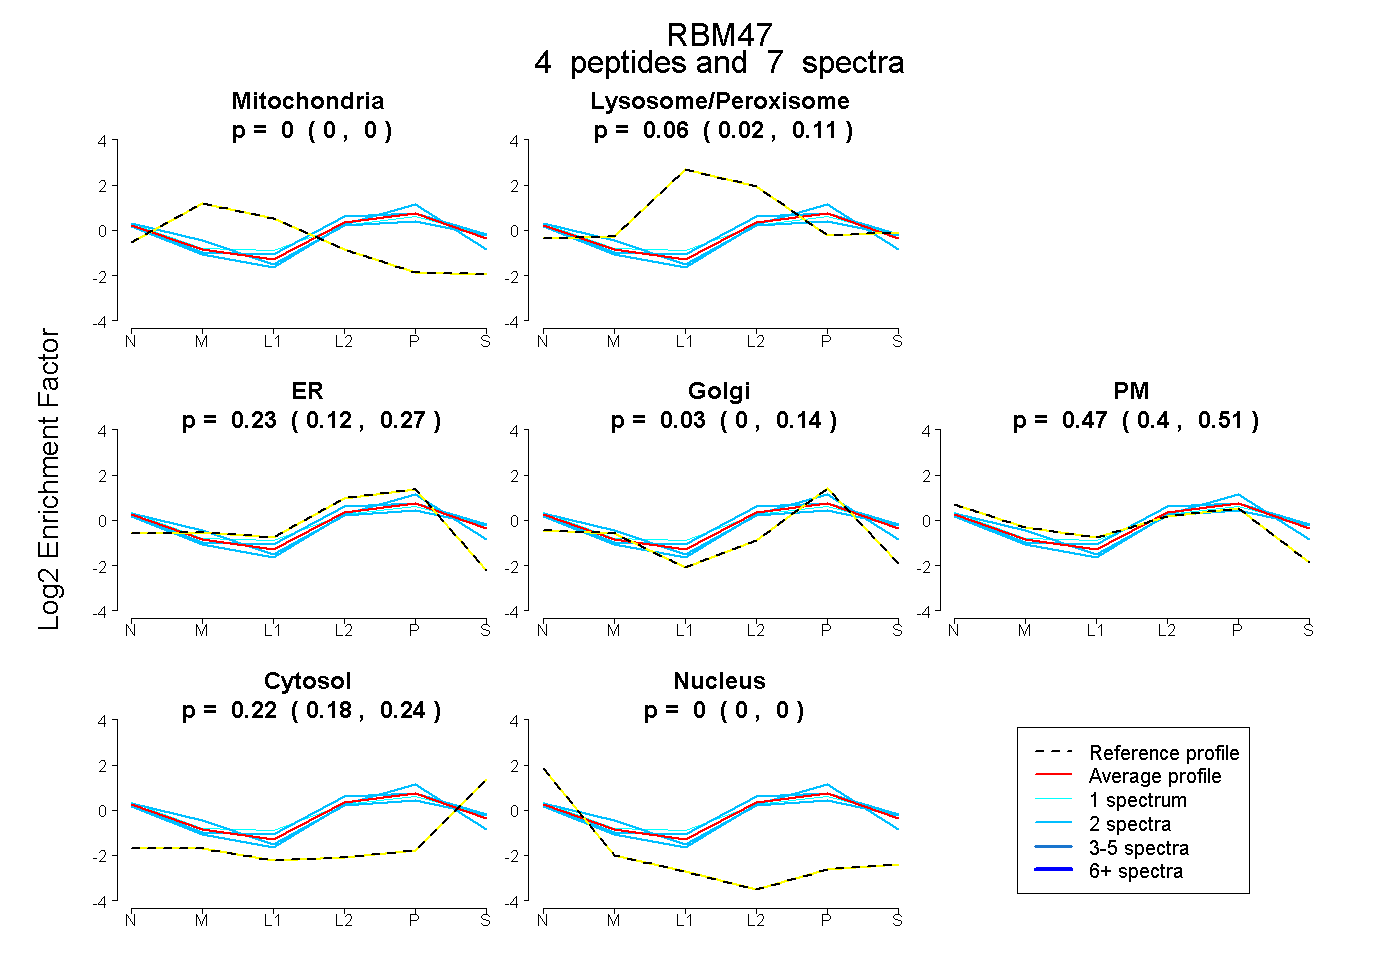 |
0.000 0.000 | 0.000 |
0.057 0.023 | 0.107 |
0.226 0.119 | 0.272 |
0.030 0.000 | 0.140 |
0.468 0.397 | 0.505 |
0.218 0.177 | 0.237 |
0.000 0.000 | 0.000 |
|||
| Plot | Lyso | Other | |||||||||||
| Expt C |
5 peptides |
20 spectra |
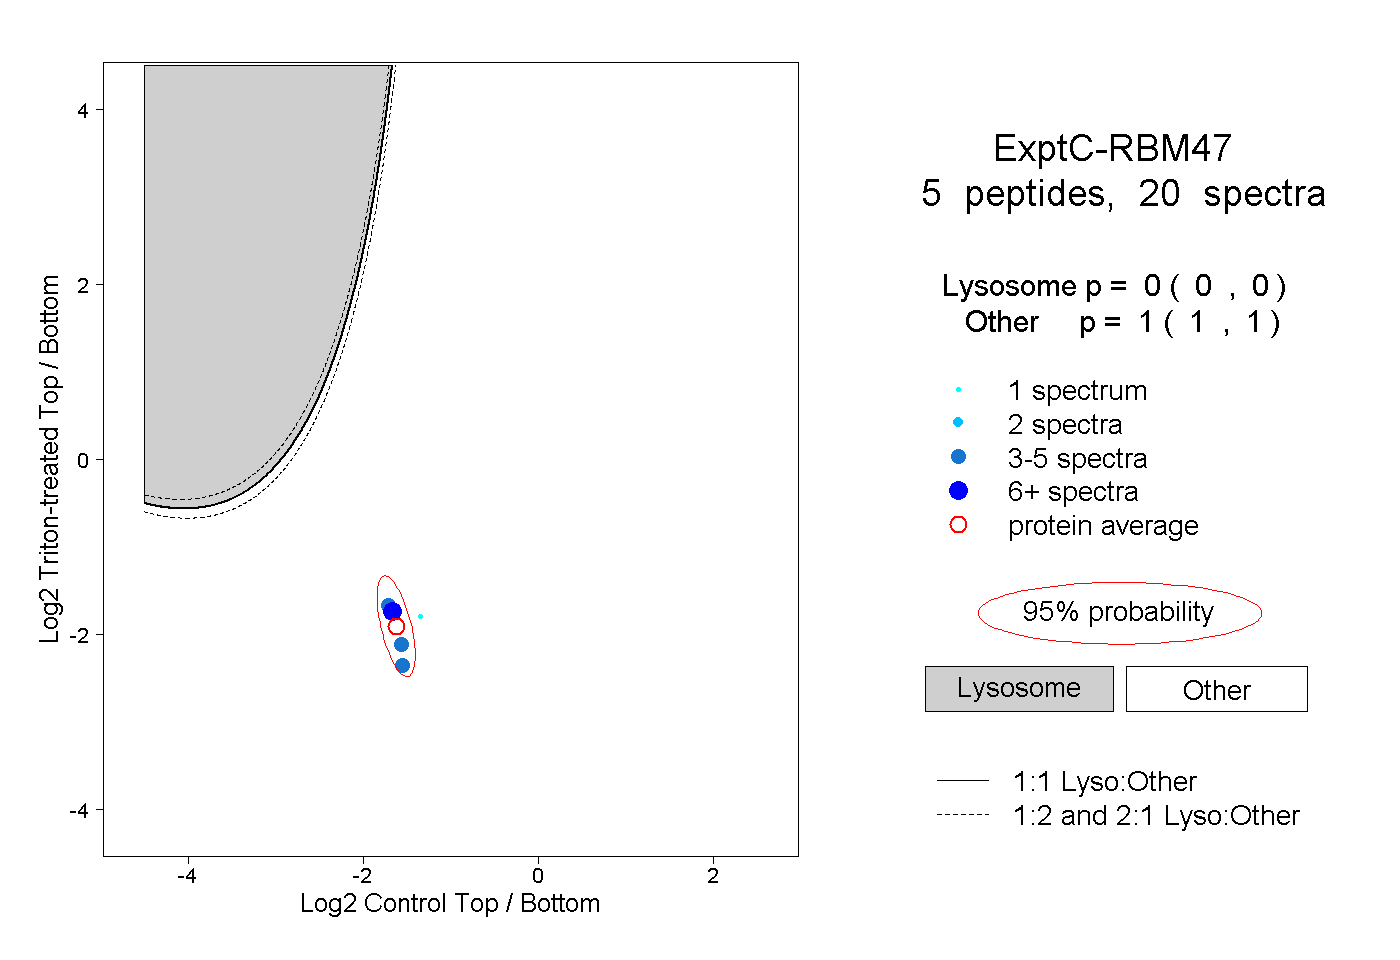 |
0.000 0.000 | 0.000 |
1.000 1.000 | 1.000 |
||||||||
| Plot | Lyso | Other | |||||||||||
| Expt D |
3 peptides |
7 spectra |
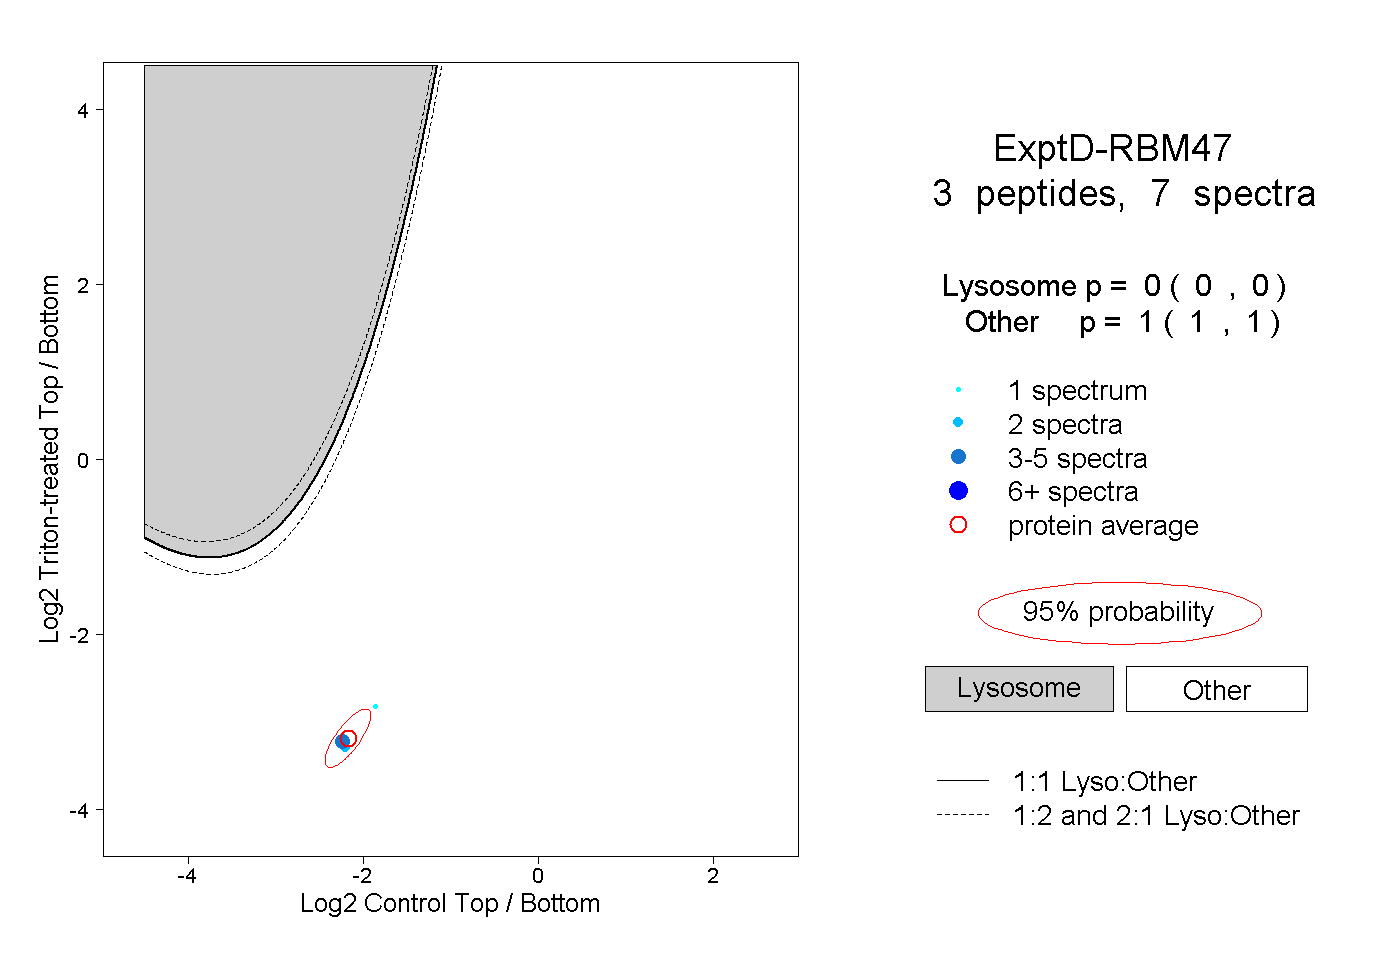 |
0.000 0.000 | 0.000 |
1.000 1.000 | 1.000 |