 5
5peptides
spectra
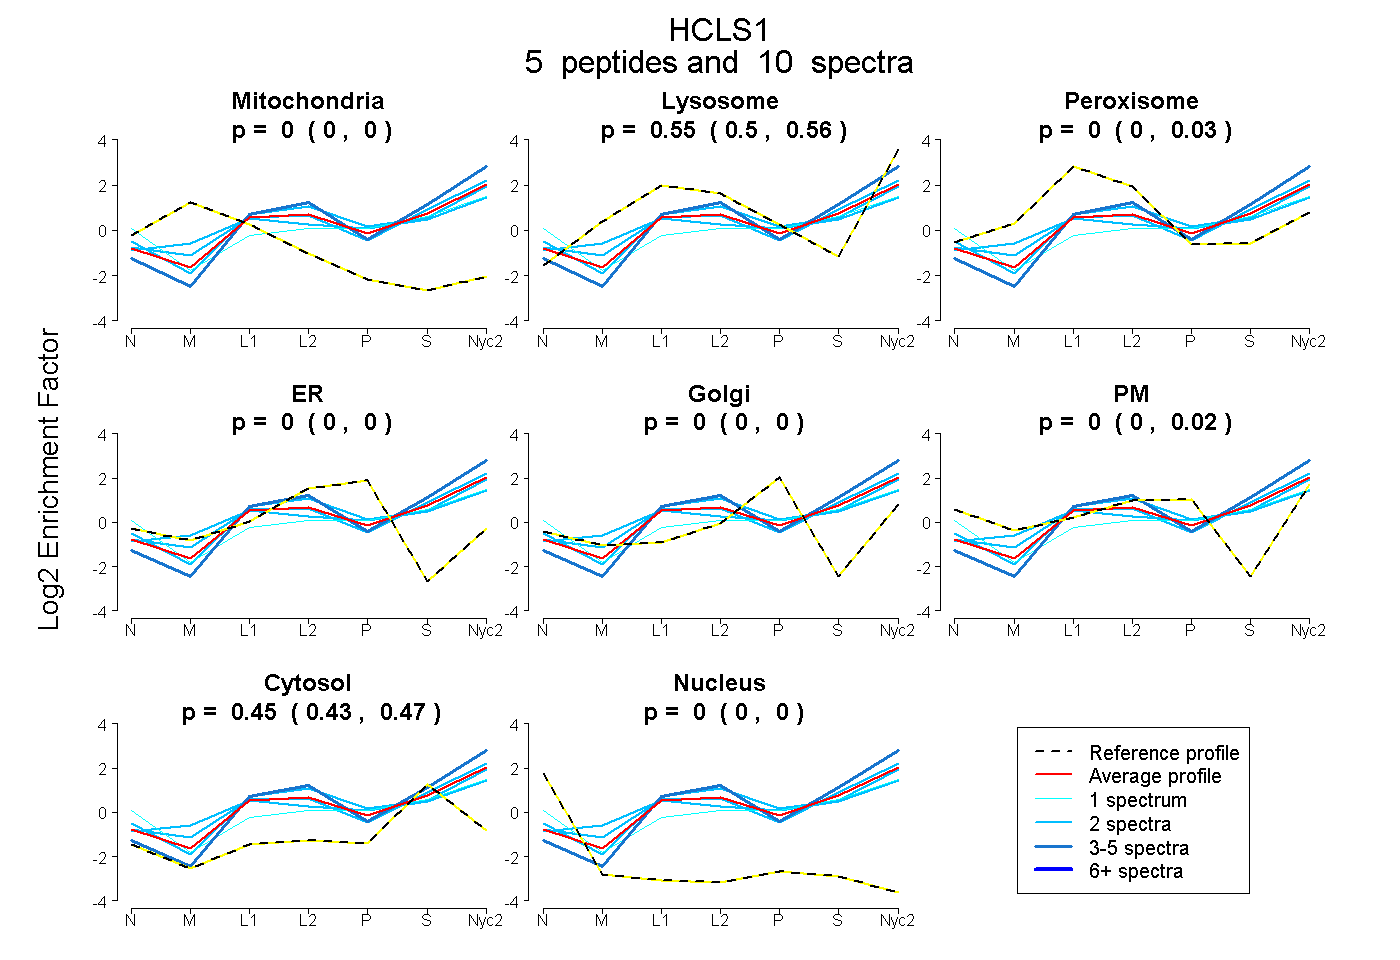
0.000 | 0.000
0.504 | 0.562
0.000 | 0.029
0.000 | 0.000
0.000 | 0.000
0.000 | 0.016
0.432 | 0.470
0.000 | 0.000
1peptide
spectrum
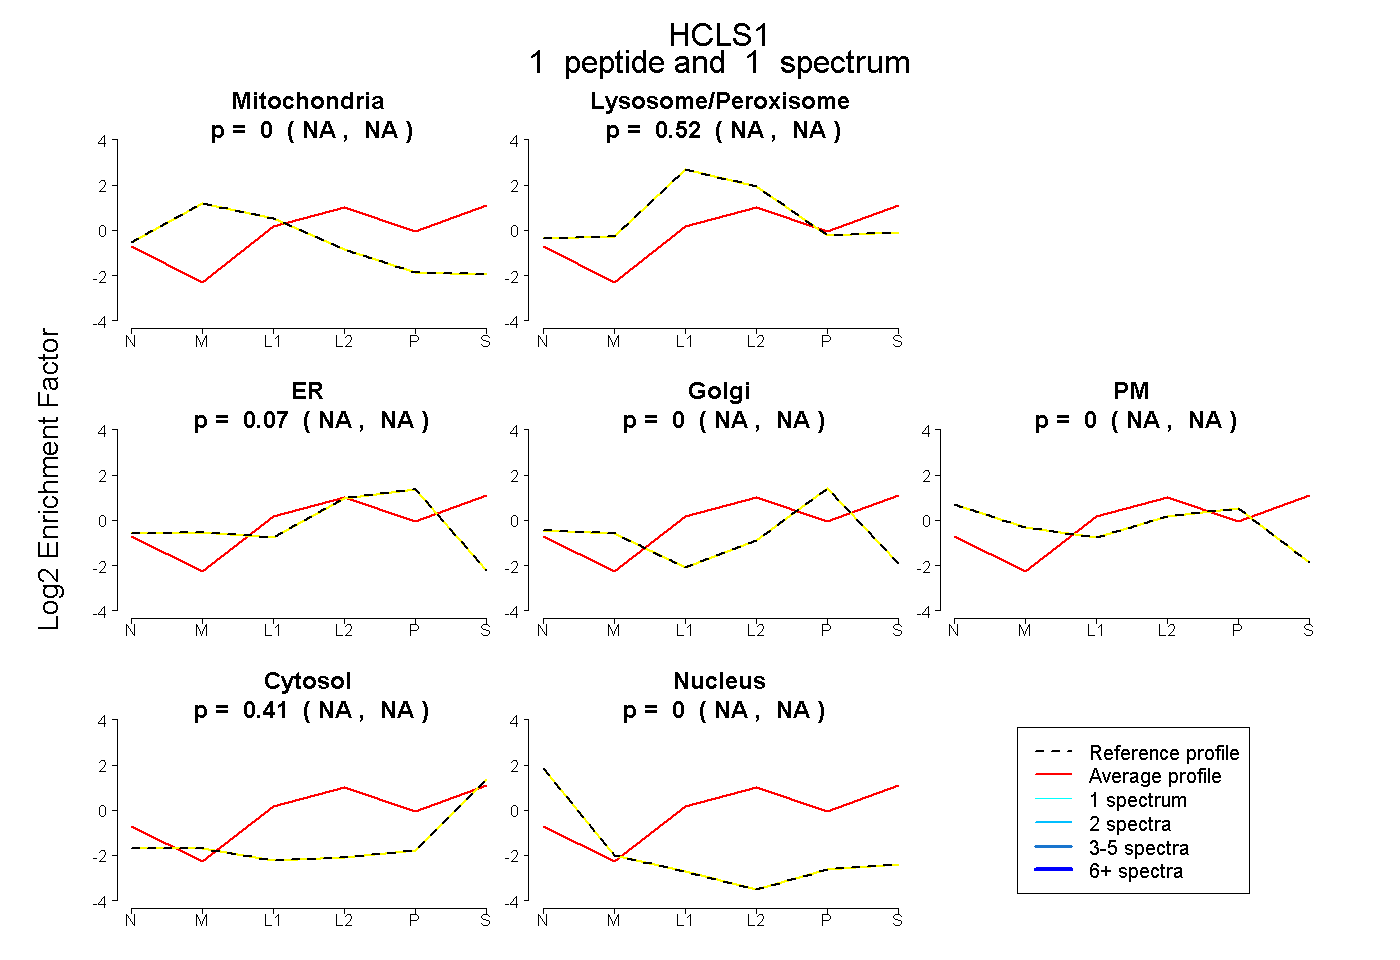
NA | NA
NA | NA
NA | NA
NA | NA
NA | NA
NA | NA
NA | NA
7peptides
spectra
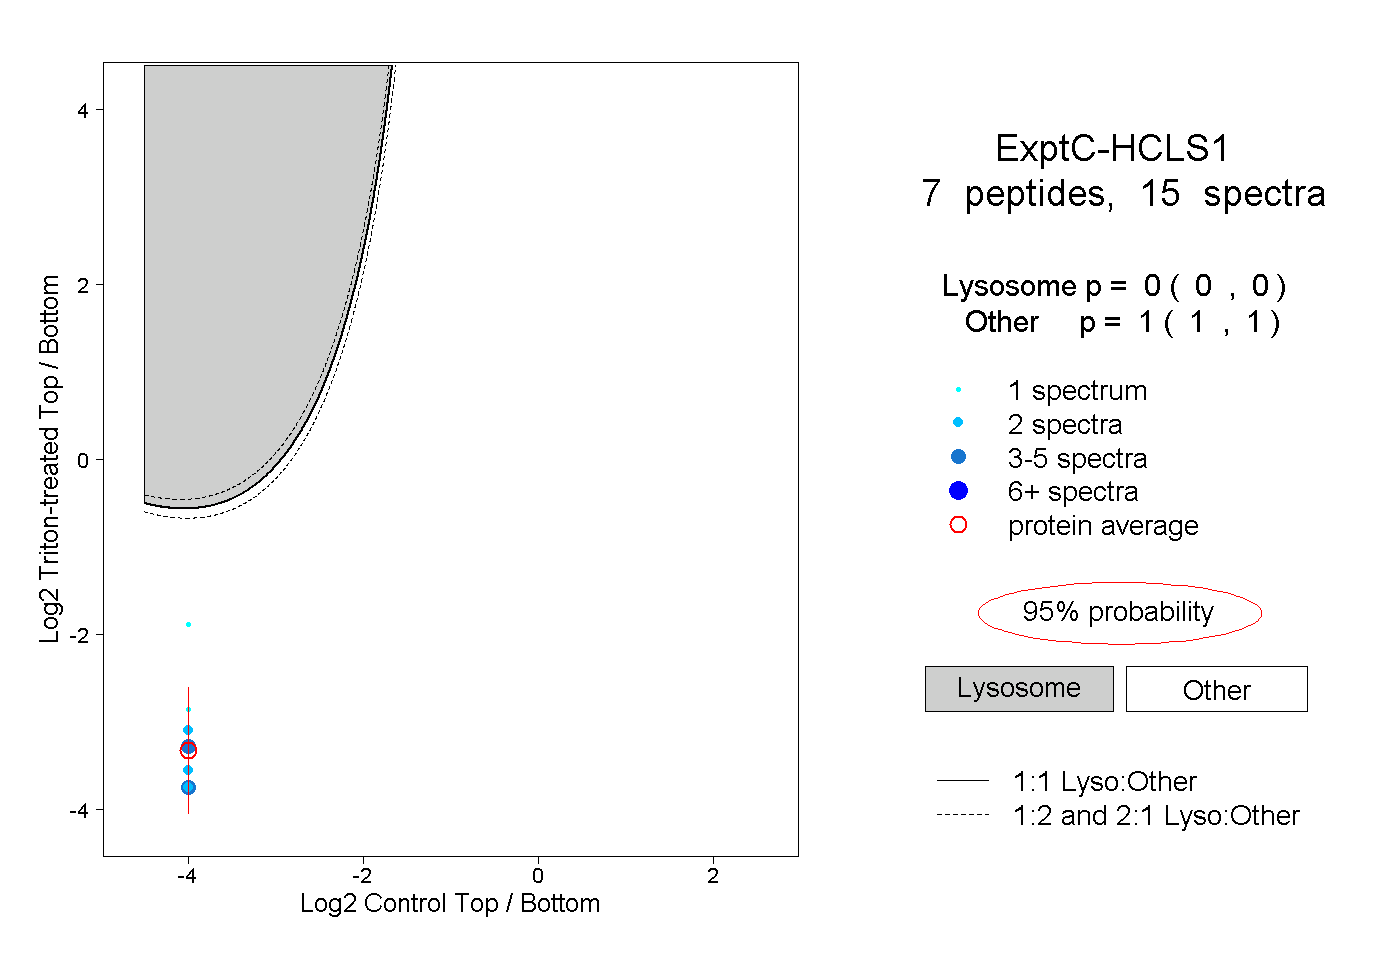
0.000 | 0.000
1.000 | 1.000