HCLS1
[ENSRNOP00000003326]
Main page
| | | Plot |
Mito |
Lyso |
|
Perox |
ER |
Golgi |
PM |
Cytosol |
Nucleus |
|
| Expt A |
 5
5
peptides |
10
spectra |
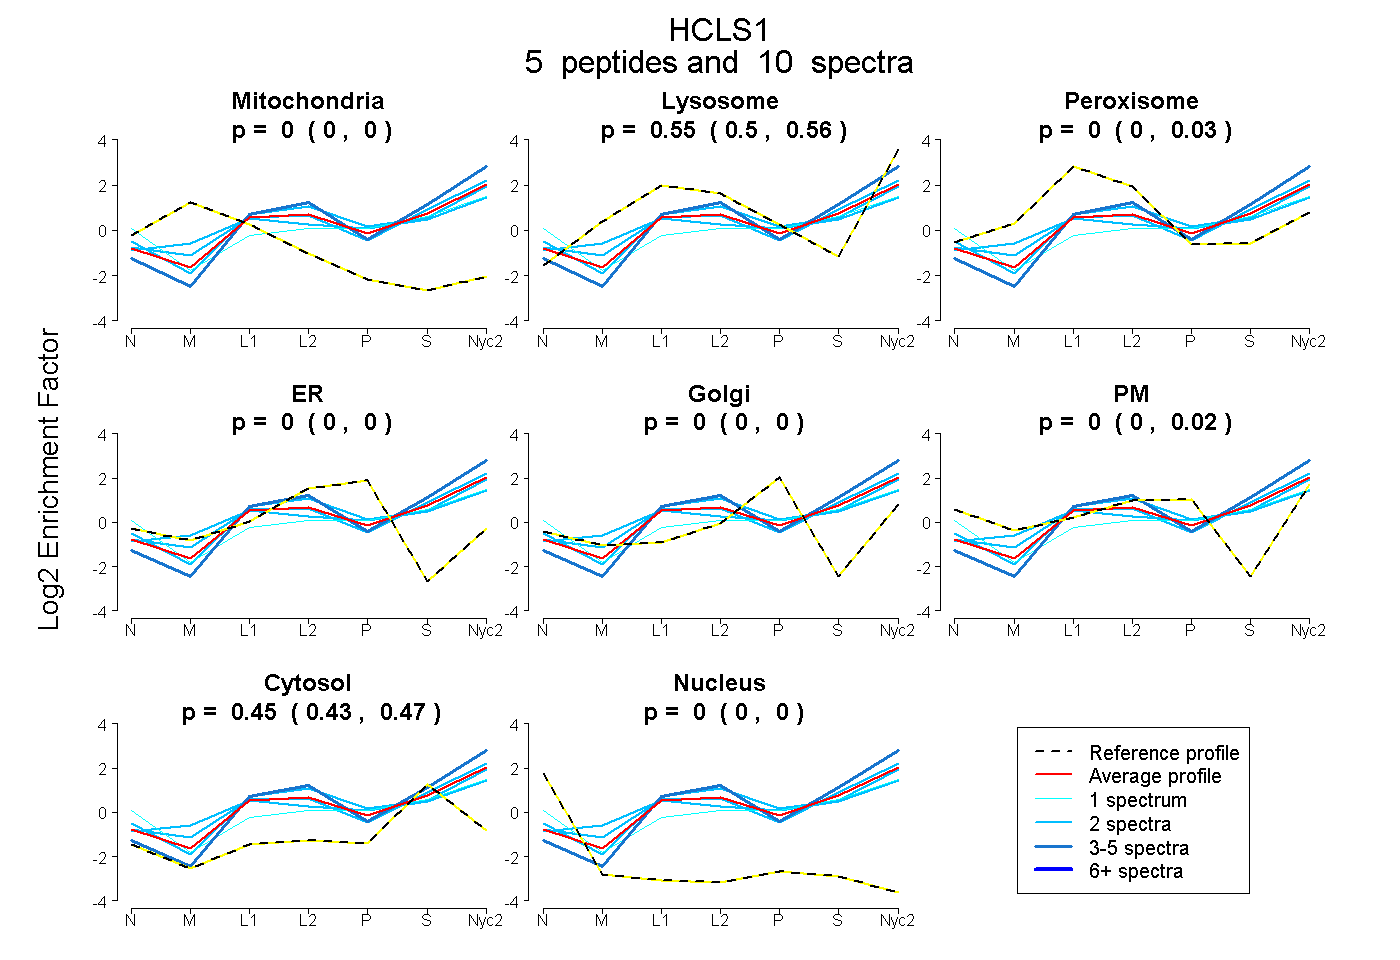 |
0.000
0.000 | 0.000 |
0.546
0.504 | 0.562 |
|
0.000
0.000 | 0.029 |
0.000
0.000 | 0.000 |
0.000
0.000 | 0.000 |
0.000
0.000 | 0.016 |
0.454
0.432 | 0.470 |
0.000
0.000 | 0.000 |
|
| | | Plot |
Mito |
|
Lyso or Perox |
|
ER |
Golgi |
PM |
Cytosol |
Nucleus |
|
| Expt B |
1
peptide |
1
spectrum |
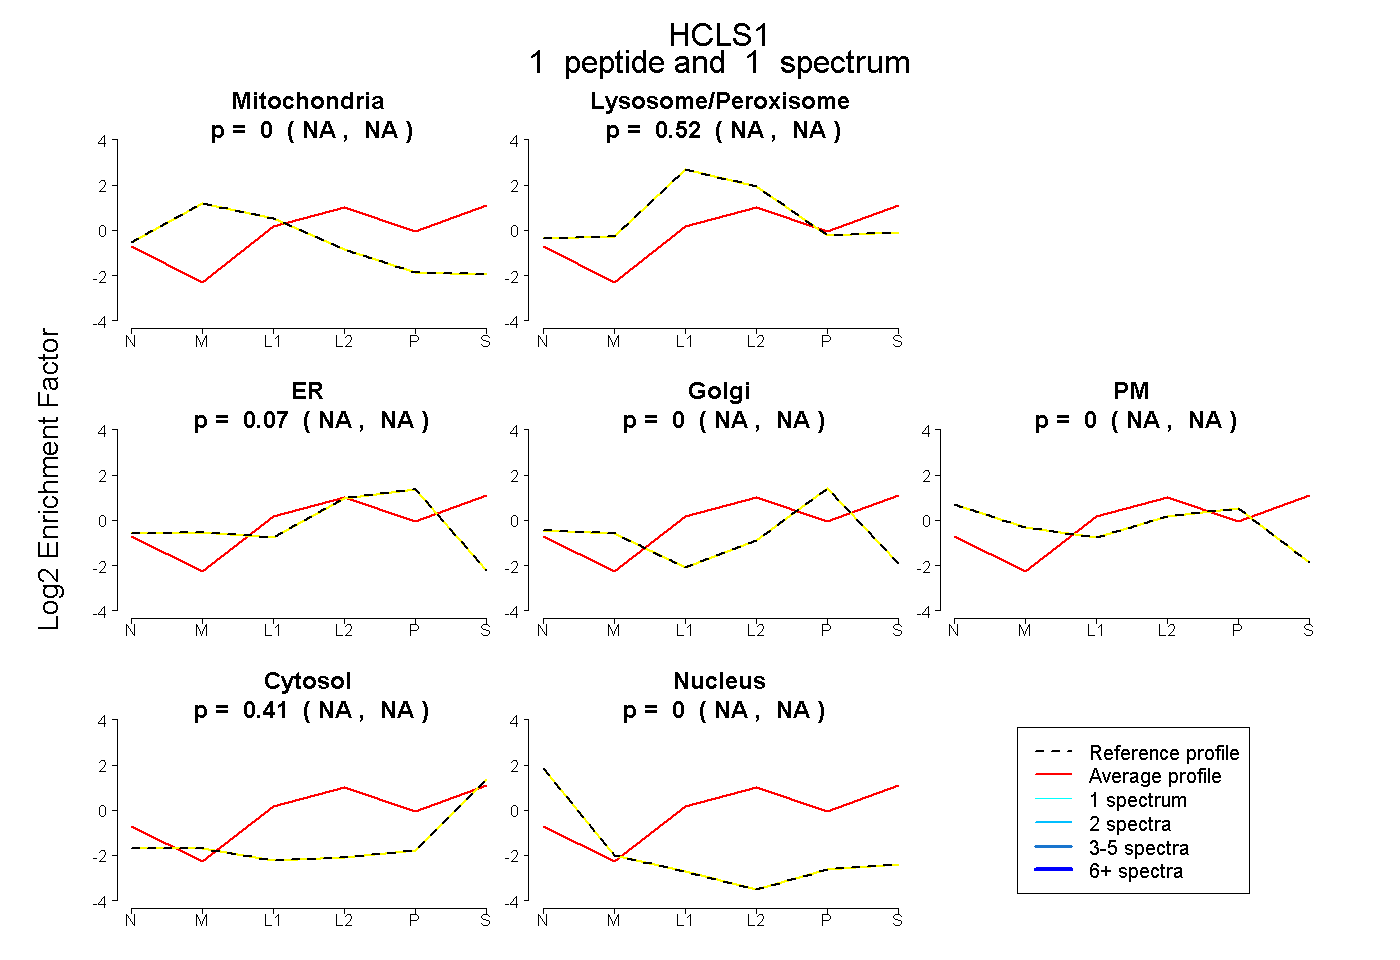 |
0.000
NA | NA |
|
0.524
NA | NA |
|
0.070
NA | NA |
0.000
NA | NA |
0.000
NA | NA |
0.406
NA | NA |
0.000
NA | NA |
|
| | | Plot |
|
Lyso |
|
|
|
|
|
|
|
Other |
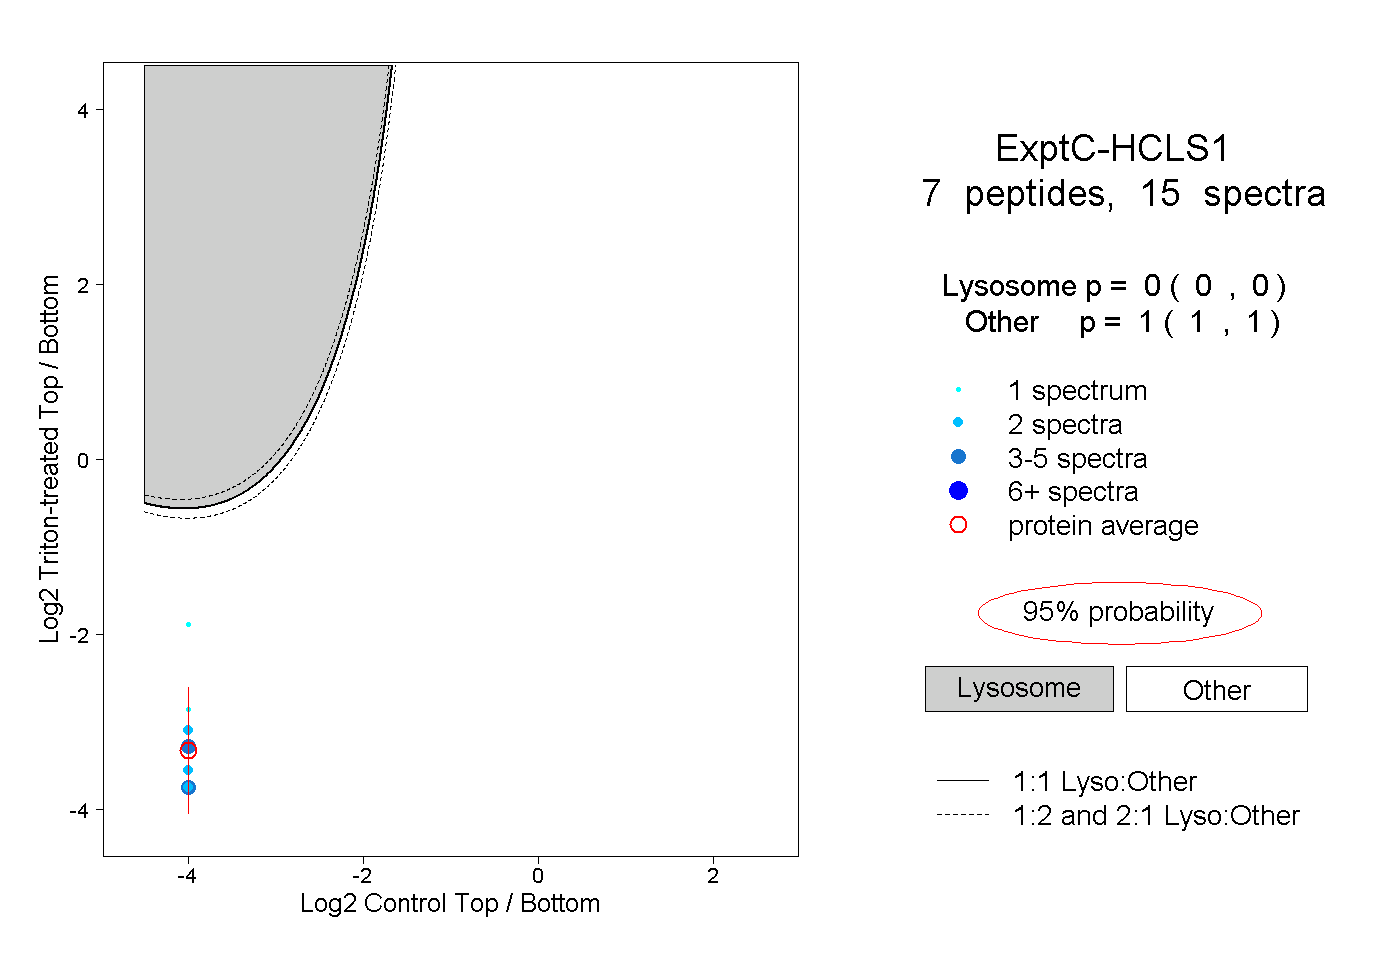
| Expt C |
7
peptides |
15
spectra |
 |
|
0.000
0.000 | 0.000 |
|
|
|
|
|
|
|
1.000
1.000 | 1.000 |
| 1 spectrum, AALGYDYK |
|
0.000 |
|
|
|
|
|
|
|
1.000 |
| 4 spectra, TTPIEAASSGAR |
|
0.000 |
|
|
|
|
|
|
|
1.000 |
| 2 spectra, EYPVPSLPTR |
|
0.000 |
|
|
|
|
|
|
|
1.000 |
| 2 spectra, ELESGPK |
|
0.000 |
|
|
|
|
|
|
|
1.000 |
| 1 spectrum, AEEMAR |
|
0.000 |
|
|
|
|
|
|
|
1.000 |
| 2 spectra, GFGGQYGIQK |
|
0.000 |
|
|
|
|
|
|
|
1.000 |
| 3 spectra, DYSHGFGGR |
|
0.000 |
|
|
|
|
|
|
|
1.000 |