 7
7peptides
spectra
0.000 | 0.000
0.000 | 0.000
0.000 | 0.000
0.376 | 0.574
0.000 | 0.175
0.000 | 0.000
0.275 | 0.338
0.089 | 0.165
1peptide
spectrum
NA | NA
NA | NA
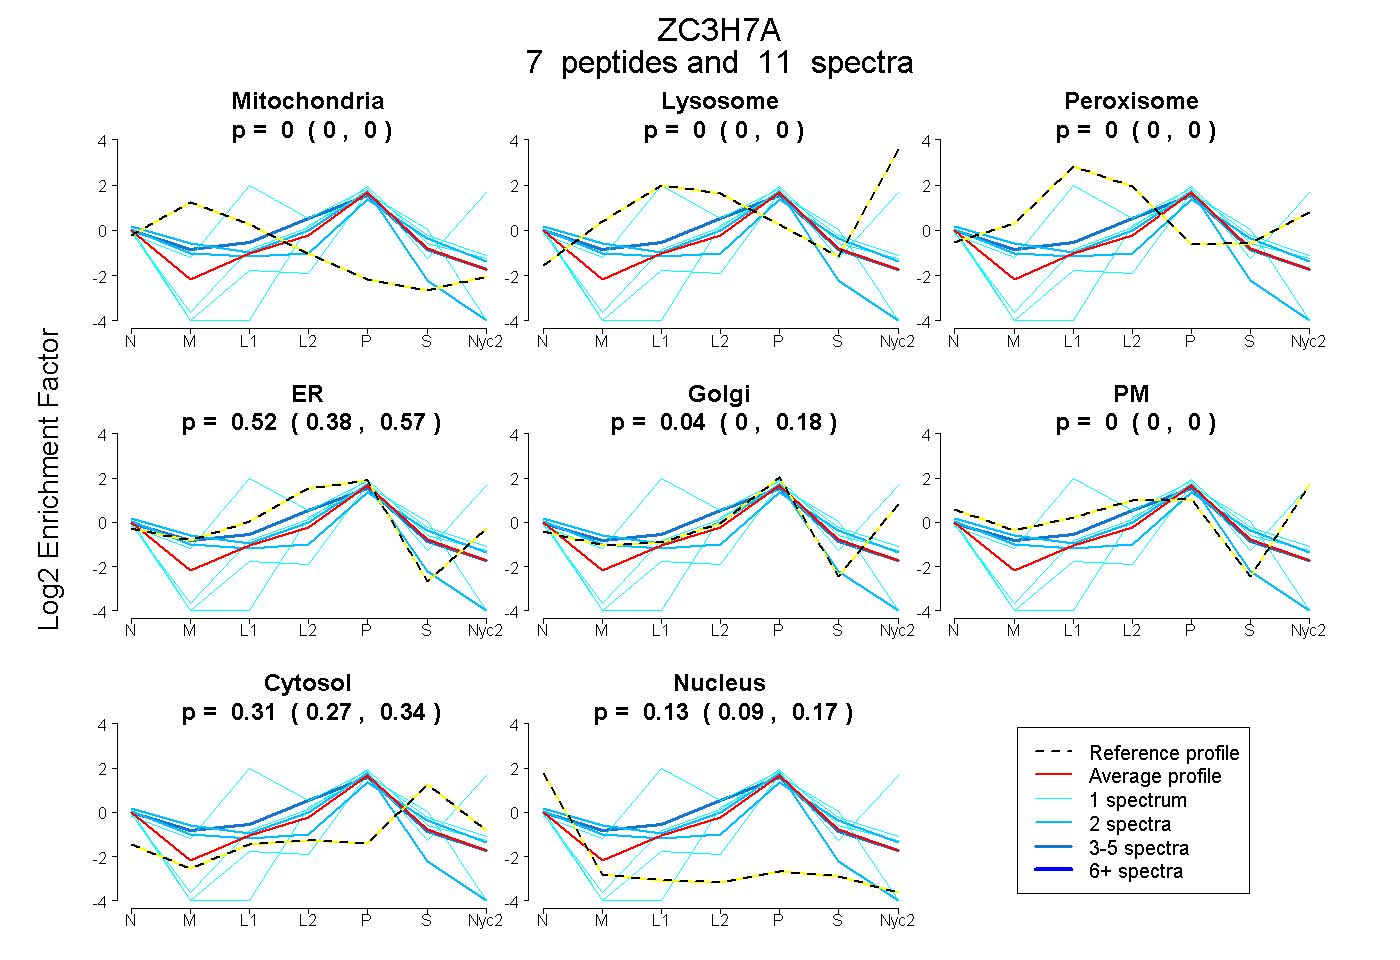
| Plot | Mito | Lyso | Perox | ER | Golgi | PM | Cytosol | Nucleus | |||||
| Expt A |
7 peptides |
11 spectra |
|
0.000 0.000 | 0.000 |
0.000 0.000 | 0.000 |
0.000 0.000 | 0.000 |
0.521 0.376 | 0.574 |
0.037 0.000 | 0.175 |
0.000 0.000 | 0.000 |
0.311 0.275 | 0.338 |
0.131 0.089 | 0.165 |
||
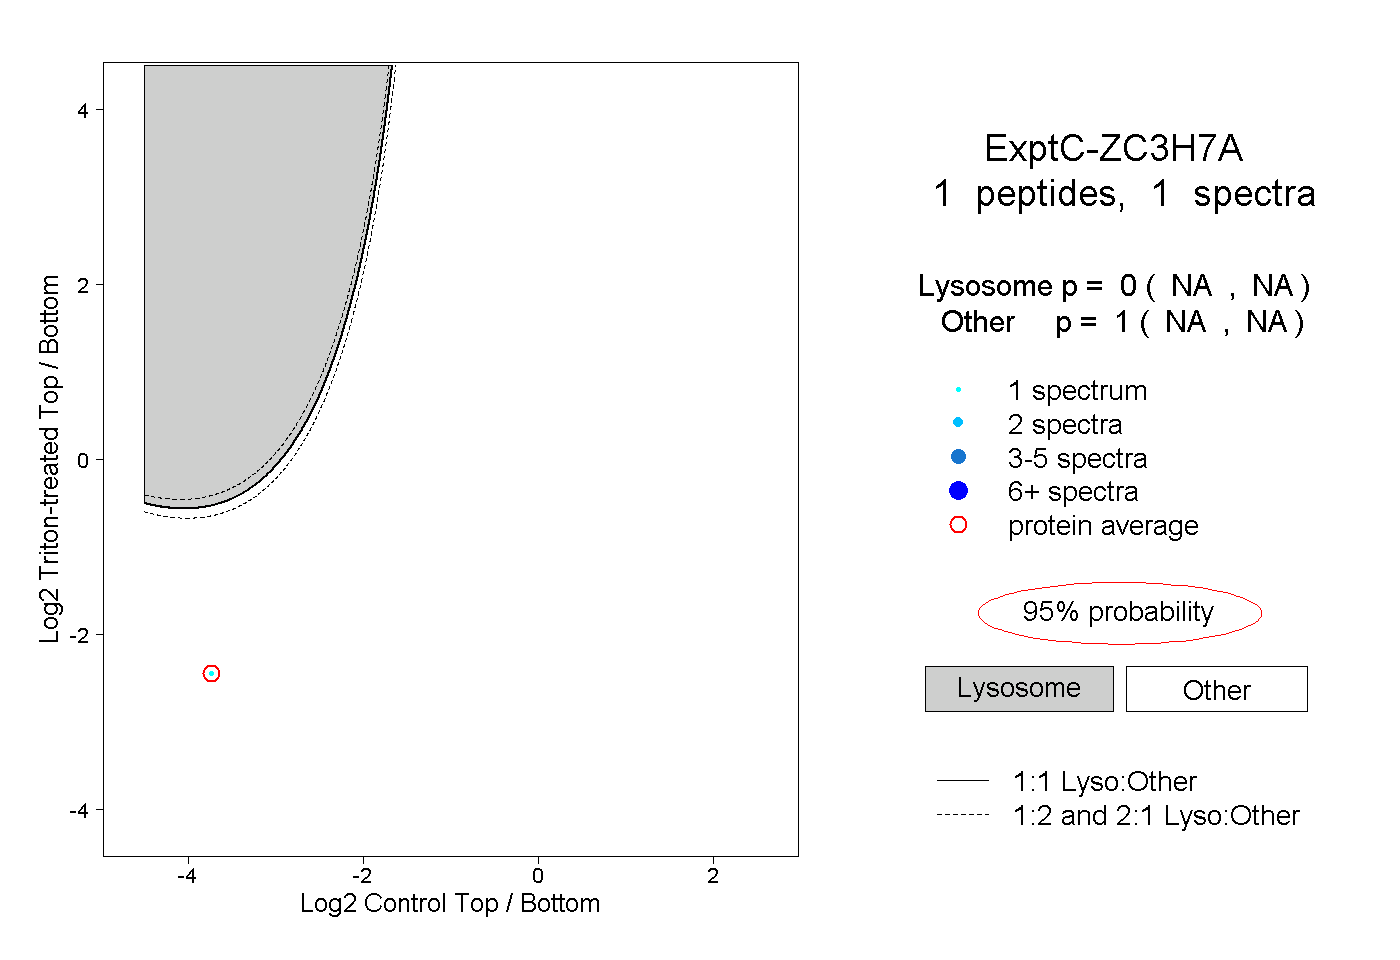
| Plot | Lyso | Other | |||||||||||
| Expt C |
1 peptide |
1 spectrum |
|
0.000 NA | NA |
1.000 NA | NA |