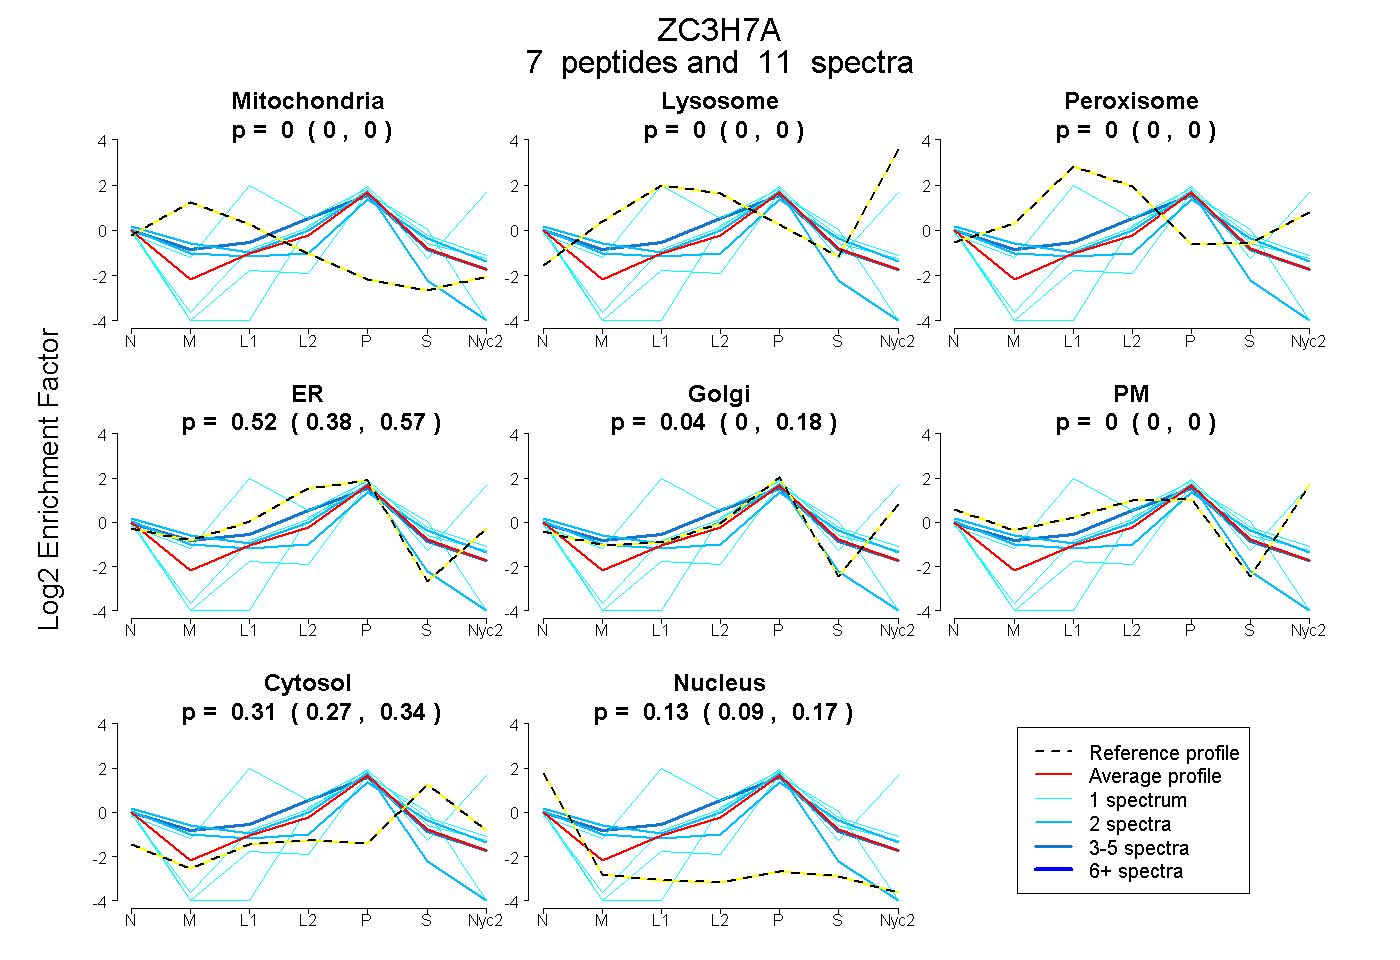
 7
7peptides
spectra
0.000 | 0.000
0.000 | 0.000
0.000 | 0.000
0.376 | 0.574
0.000 | 0.175
0.000 | 0.000
0.275 | 0.338
0.089 | 0.165
| Plot | Mito | Lyso | Perox | ER | Golgi | PM | Cytosol | Nucleus | |||||
| Expt A |
7 peptides |
11 spectra |
|
0.000 0.000 | 0.000 |
0.000 0.000 | 0.000 |
0.000 0.000 | 0.000 |
0.521 0.376 | 0.574 |
0.037 0.000 | 0.175 |
0.000 0.000 | 0.000 |
0.311 0.275 | 0.338 |
0.131 0.089 | 0.165 |
| 1 spectrum, LMDFTYHANLDHK | 0.000 | 0.000 | 0.000 | 0.252 | 0.000 | 0.000 | 0.403 | 0.345 | ||
| 1 spectrum, GPLPTASAAPGFPFR | 0.000 | 0.000 | 0.000 | 0.000 | 0.389 | 0.000 | 0.436 | 0.175 | ||
| 2 spectra, HPLEGTHELR | 0.049 | 0.000 | 0.000 | 0.636 | 0.000 | 0.000 | 0.000 | 0.315 | ||
| 1 spectrum, DNSTACSHPVTK | 0.000 | 0.223 | 0.308 | 0.000 | 0.469 | 0.000 | 0.000 | 0.000 | ||
| 3 spectra, CLVHILR | 0.001 | 0.000 | 0.000 | 0.685 | 0.000 | 0.000 | 0.254 | 0.060 | ||
| 2 spectra, NLFNEGNDVYR | 0.000 | 0.000 | 0.000 | 0.199 | 0.339 | 0.000 | 0.350 | 0.113 | ||
| 1 spectrum, APSLLGTLPIGAR | 0.000 | 0.000 | 0.000 | 0.488 | 0.062 | 0.000 | 0.400 | 0.051 |
| Plot | Lyso | Other | |||||||||||
| Expt C |
1 peptide |
1 spectrum |
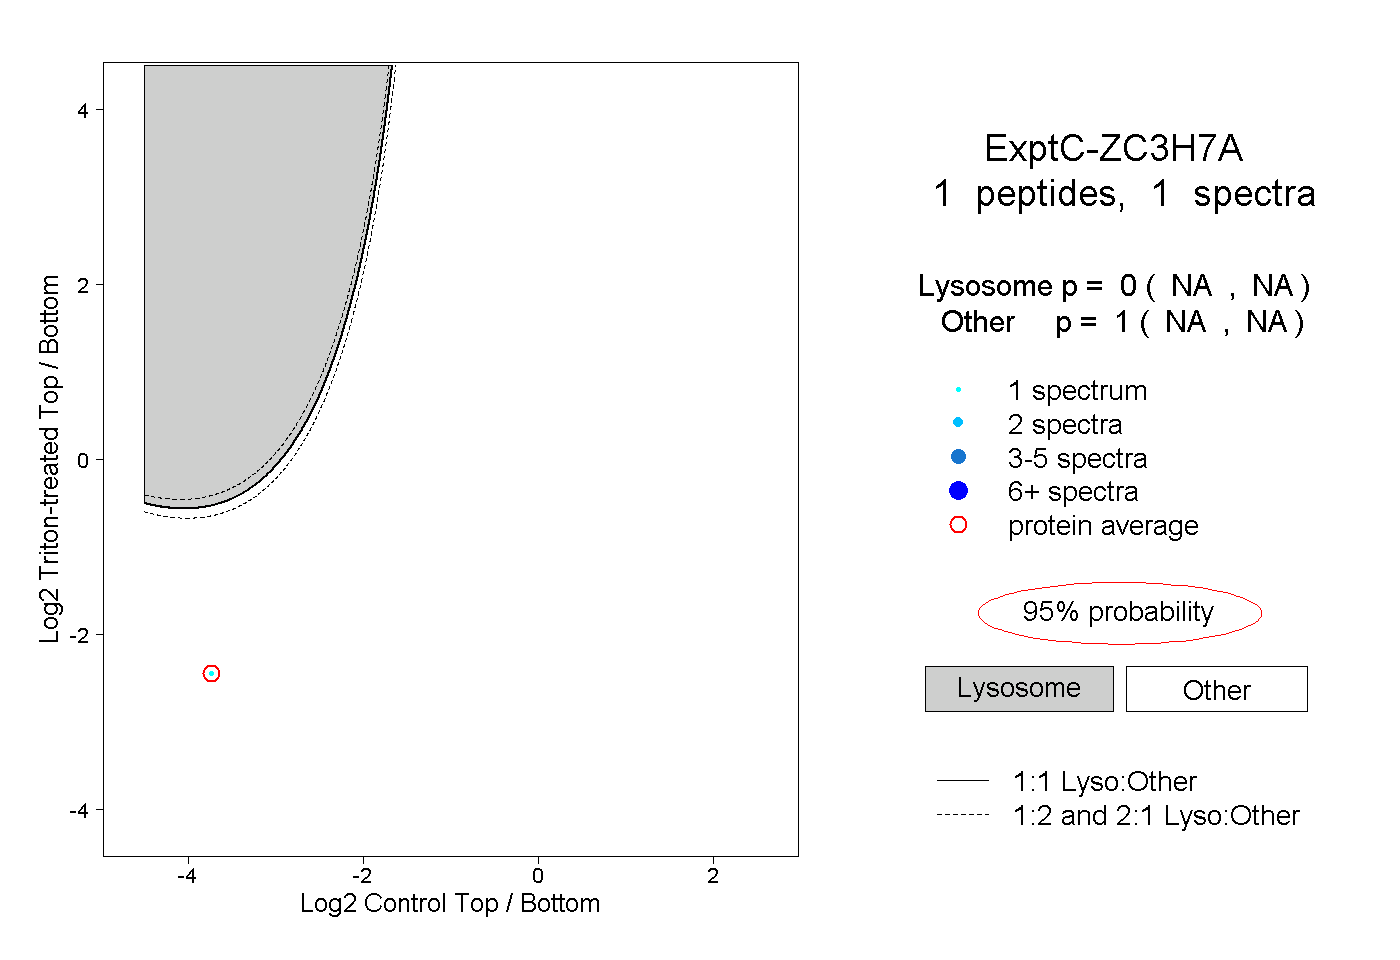 |
0.000 NA | NA |
1.000 NA | NA |