 8
8peptides
spectra
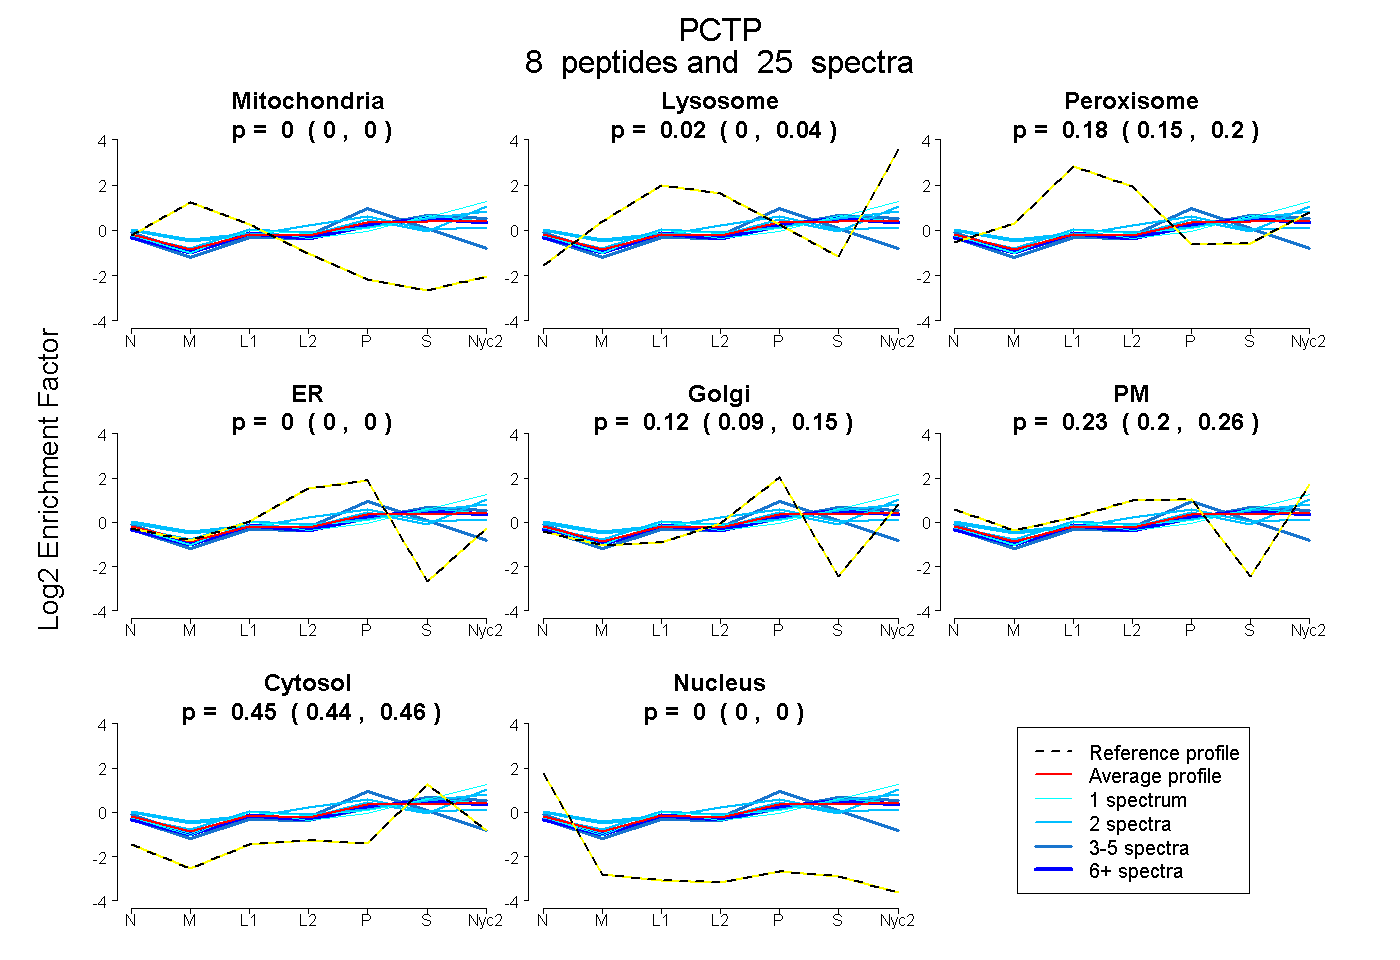
0.000 | 0.000
0.000 | 0.040
0.147 | 0.199
0.000 | 0.000
0.090 | 0.151
0.200 | 0.262
0.438 | 0.456
0.000 | 0.000
2peptides
spectra
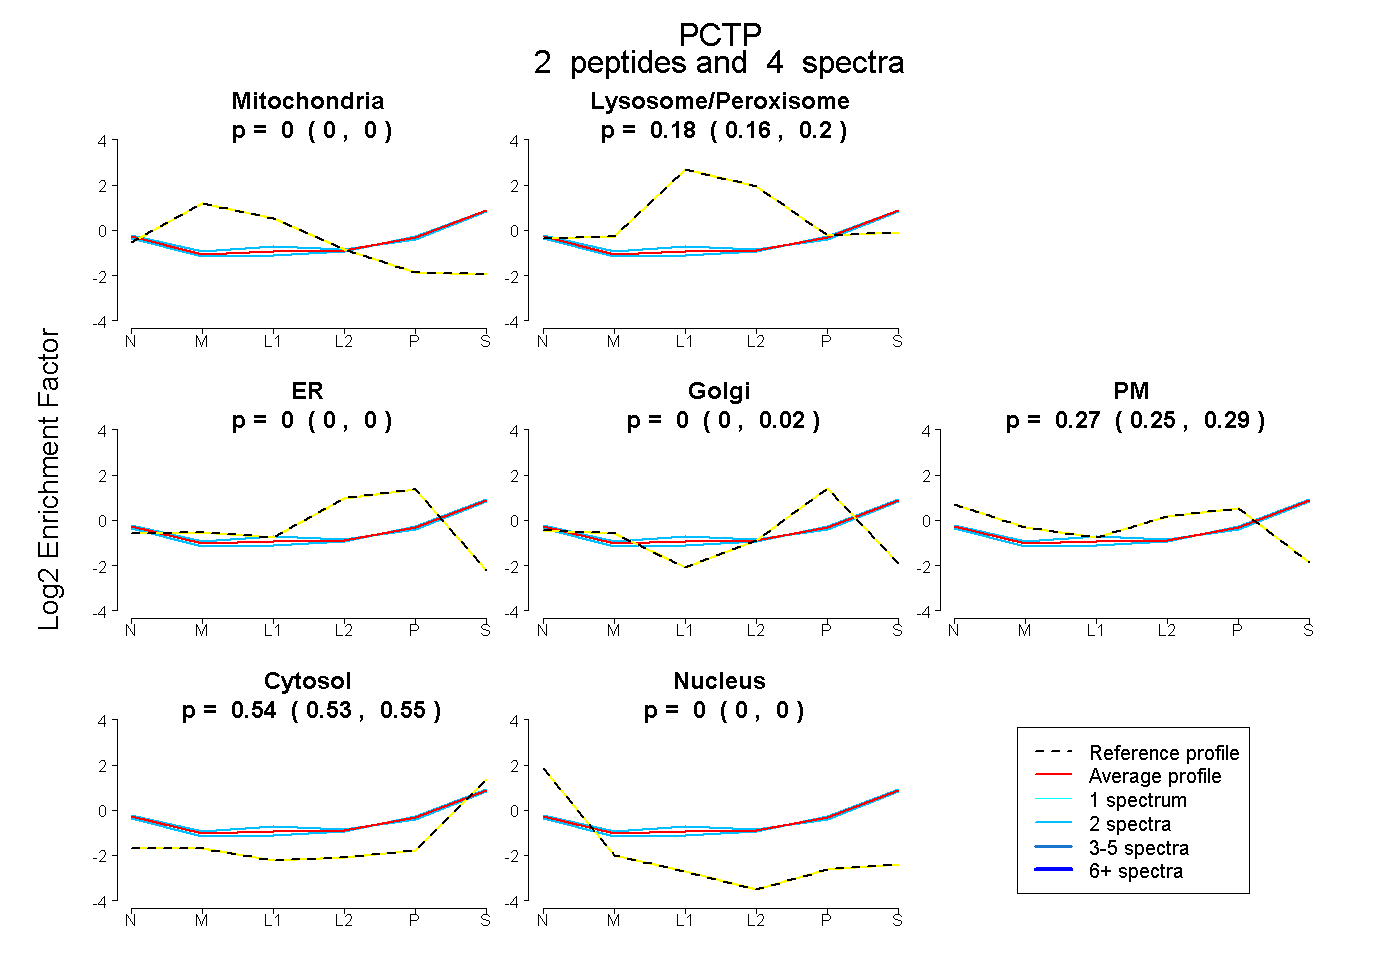
0.000 | 0.000
0.162 | 0.201
0.000 | 0.000
0.000 | 0.017
0.249 | 0.285
0.534 | 0.553
0.000 | 0.000
6peptides
spectra
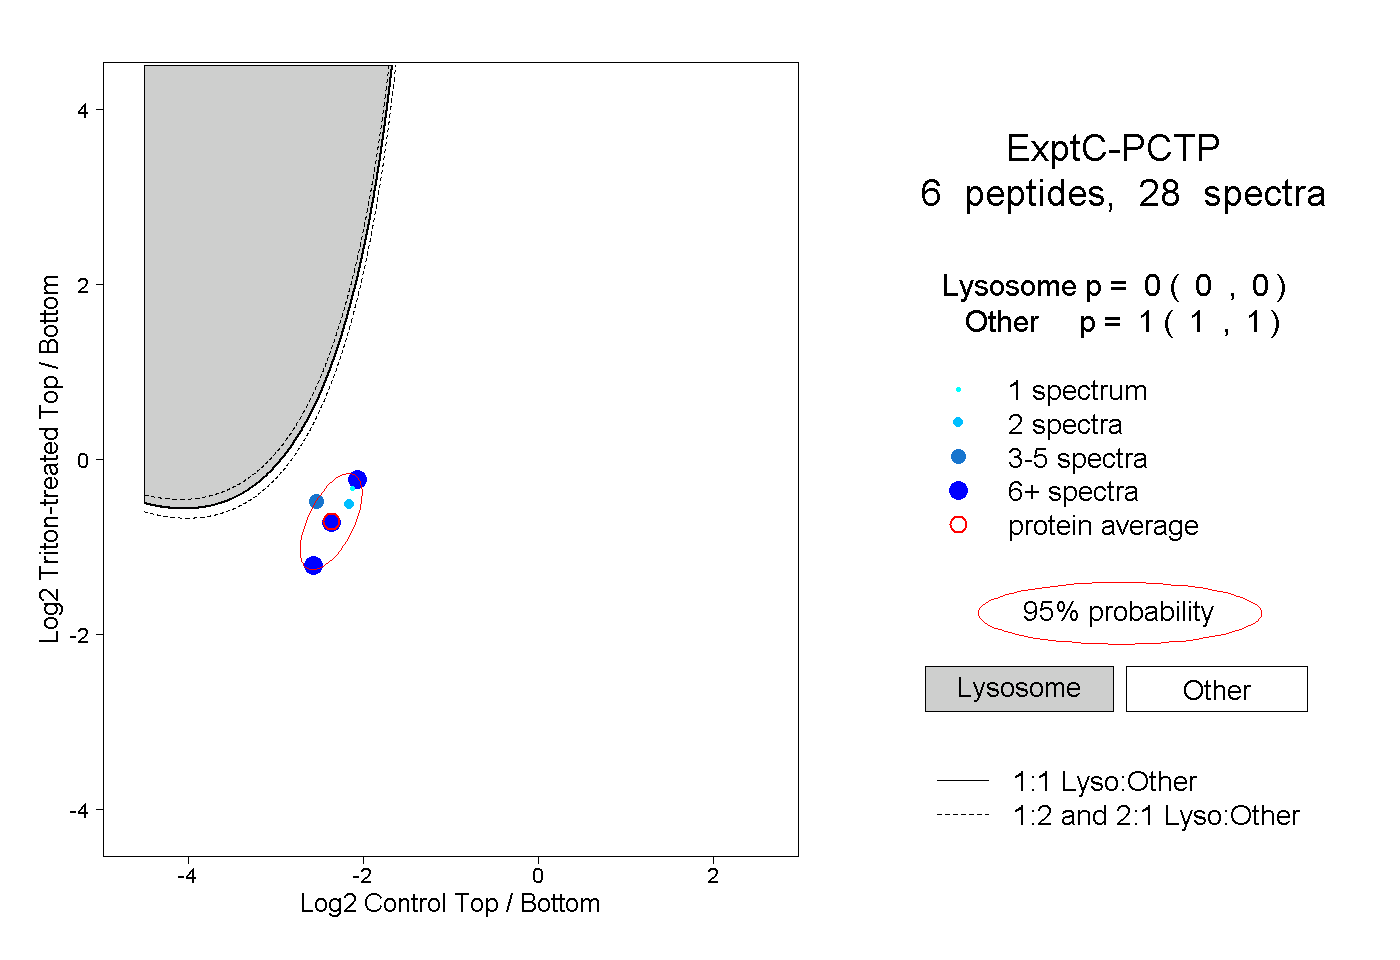
0.000 | 0.000
1.000 | 1.000
2peptides
spectra
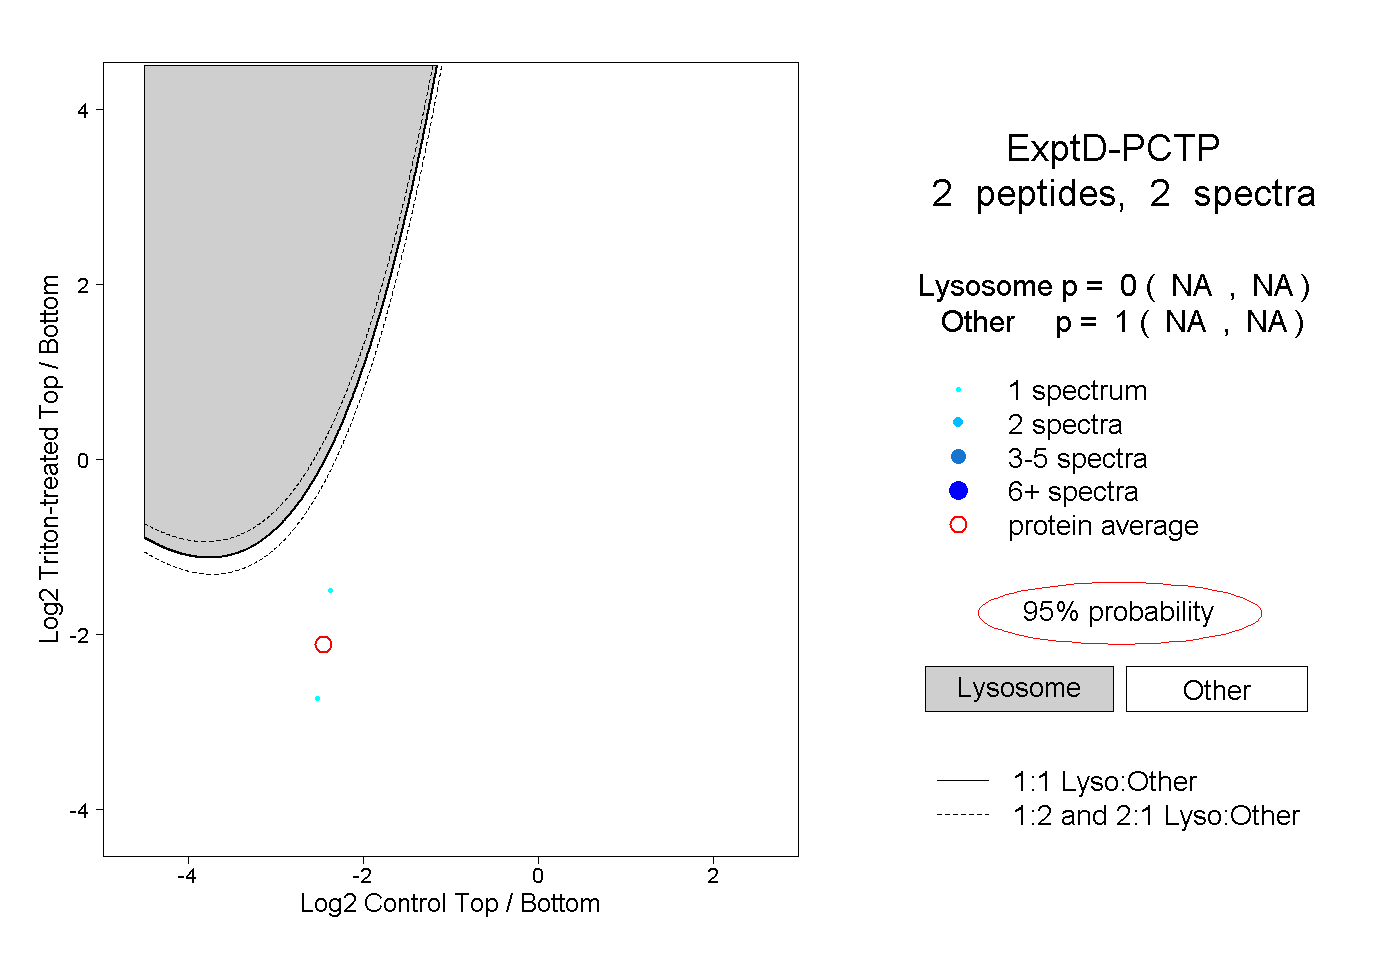
NA | NA
NA | NA