 8
8peptides
spectra
0.000 | 0.000
0.000 | 0.040
0.147 | 0.199
0.000 | 0.000
0.090 | 0.151
0.200 | 0.262
0.438 | 0.456
0.000 | 0.000
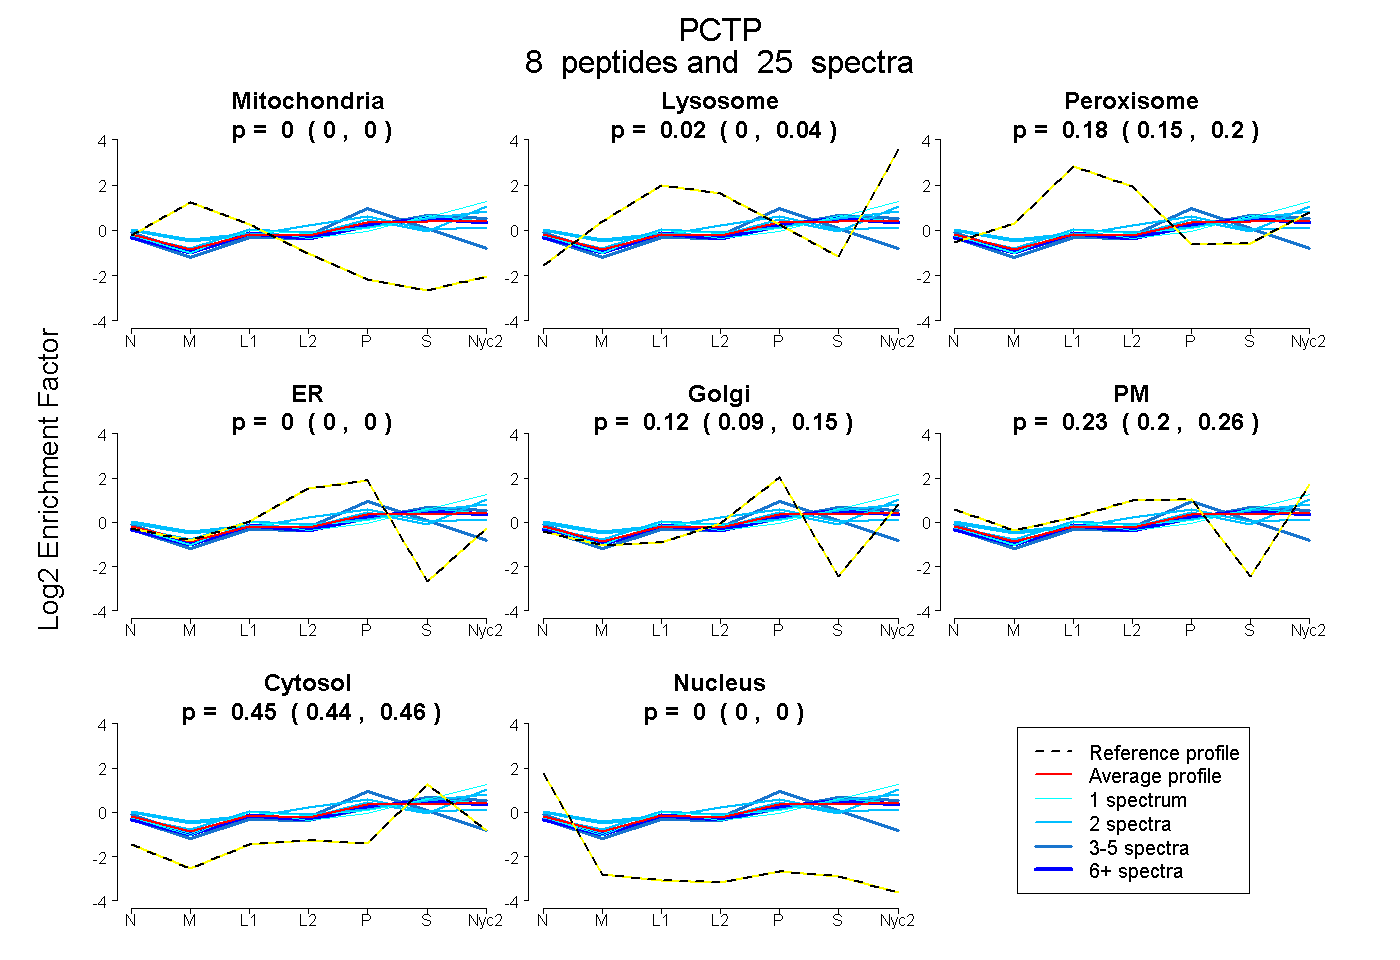
| Plot | Mito | Lyso | Perox | ER | Golgi | PM | Cytosol | Nucleus | |||||
| Expt A |
8 peptides |
25 spectra |
|
0.000 0.000 | 0.000 |
0.017 0.000 | 0.040 |
0.177 0.147 | 0.199 |
0.000 0.000 | 0.000 |
0.123 0.090 | 0.151 |
0.234 0.200 | 0.262 |
0.448 0.438 | 0.456 |
0.000 0.000 | 0.000 |
| 2 spectra, SFDGQMVAYWEVK | 0.000 | 0.118 | 0.032 | 0.000 | 0.000 | 0.474 | 0.376 | 0.000 | ||
| 1 spectrum, LLDQSTGLYEYK | 0.000 | 0.018 | 0.202 | 0.000 | 0.000 | 0.256 | 0.524 | 0.000 | ||
| 1 spectrum, YPFPLSNR | 0.000 | 0.263 | 0.010 | 0.000 | 0.000 | 0.249 | 0.478 | 0.000 | ||
| 2 spectra, WDQYVK | 0.000 | 0.136 | 0.130 | 0.000 | 0.000 | 0.270 | 0.465 | 0.000 | ||
| 3 spectra, DLDVDGR | 0.000 | 0.095 | 0.063 | 0.000 | 0.018 | 0.269 | 0.555 | 0.000 | ||
| 10 spectra, DYVYTR | 0.000 | 0.027 | 0.190 | 0.000 | 0.123 | 0.170 | 0.490 | 0.000 | ||
| 4 spectra, ACQNYHK | 0.002 | 0.000 | 0.093 | 0.366 | 0.094 | 0.000 | 0.445 | 0.000 | ||
| 2 spectra, AGPAAHFSDEQFR | 0.000 | 0.000 | 0.225 | 0.046 | 0.193 | 0.187 | 0.349 | 0.000 |
| Plot | Mito | Lyso or Perox | ER | Golgi | PM | Cytosol | Nucleus | ||||||
| Expt B |
2 peptides |
4 spectra |
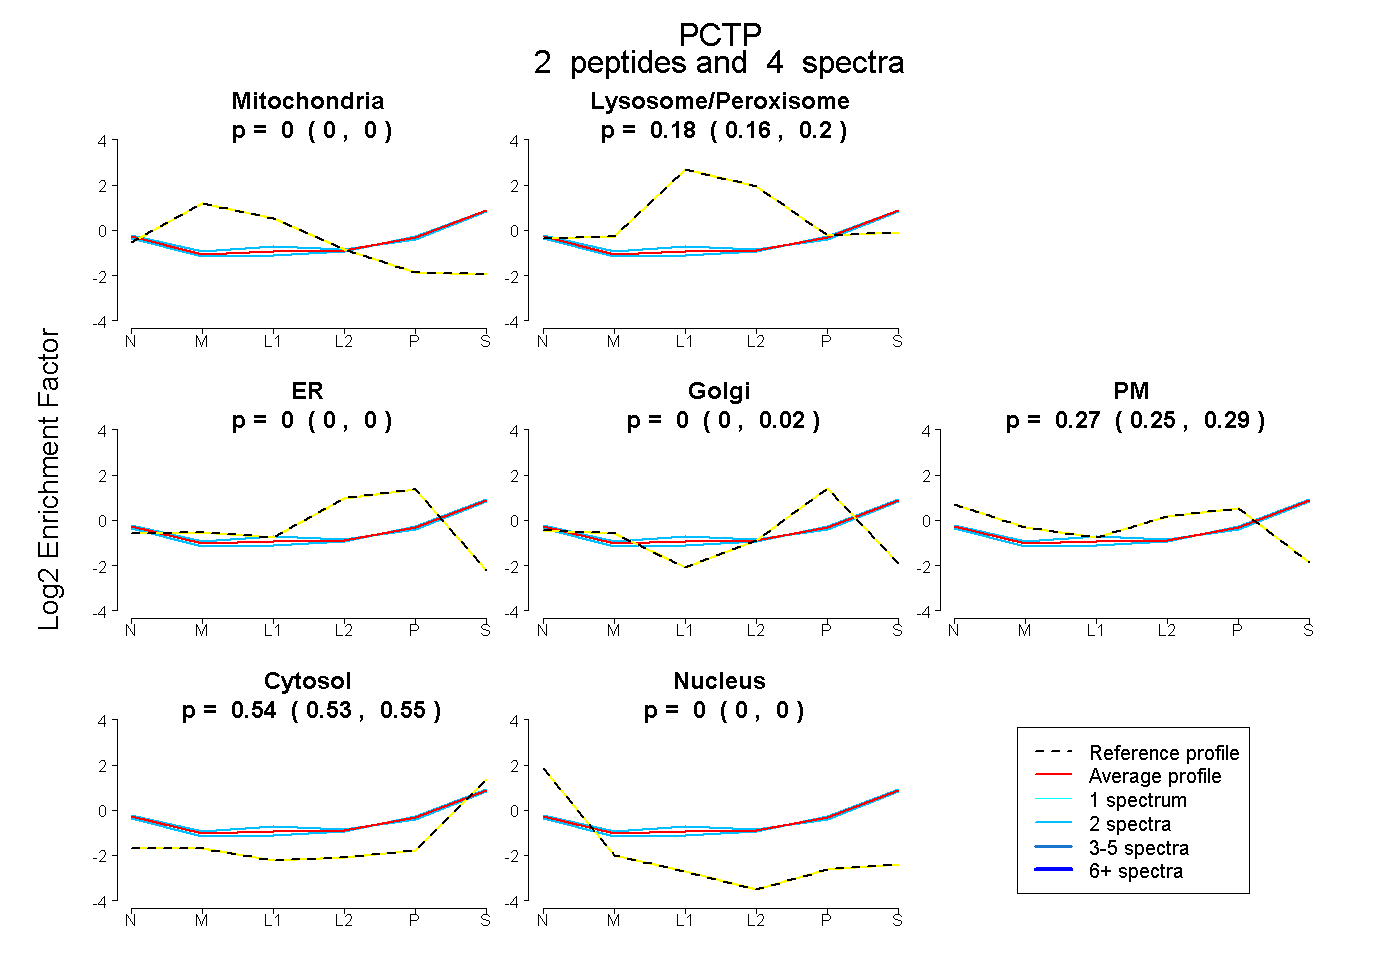 |
0.000 0.000 | 0.000 |
0.182 0.162 | 0.201 |
0.000 0.000 | 0.000 |
0.000 0.000 | 0.017 |
0.273 0.249 | 0.285 |
0.544 0.534 | 0.553 |
0.000 0.000 | 0.000 |
|||
| Plot | Lyso | Other | |||||||||||
| Expt C |
6 peptides |
28 spectra |
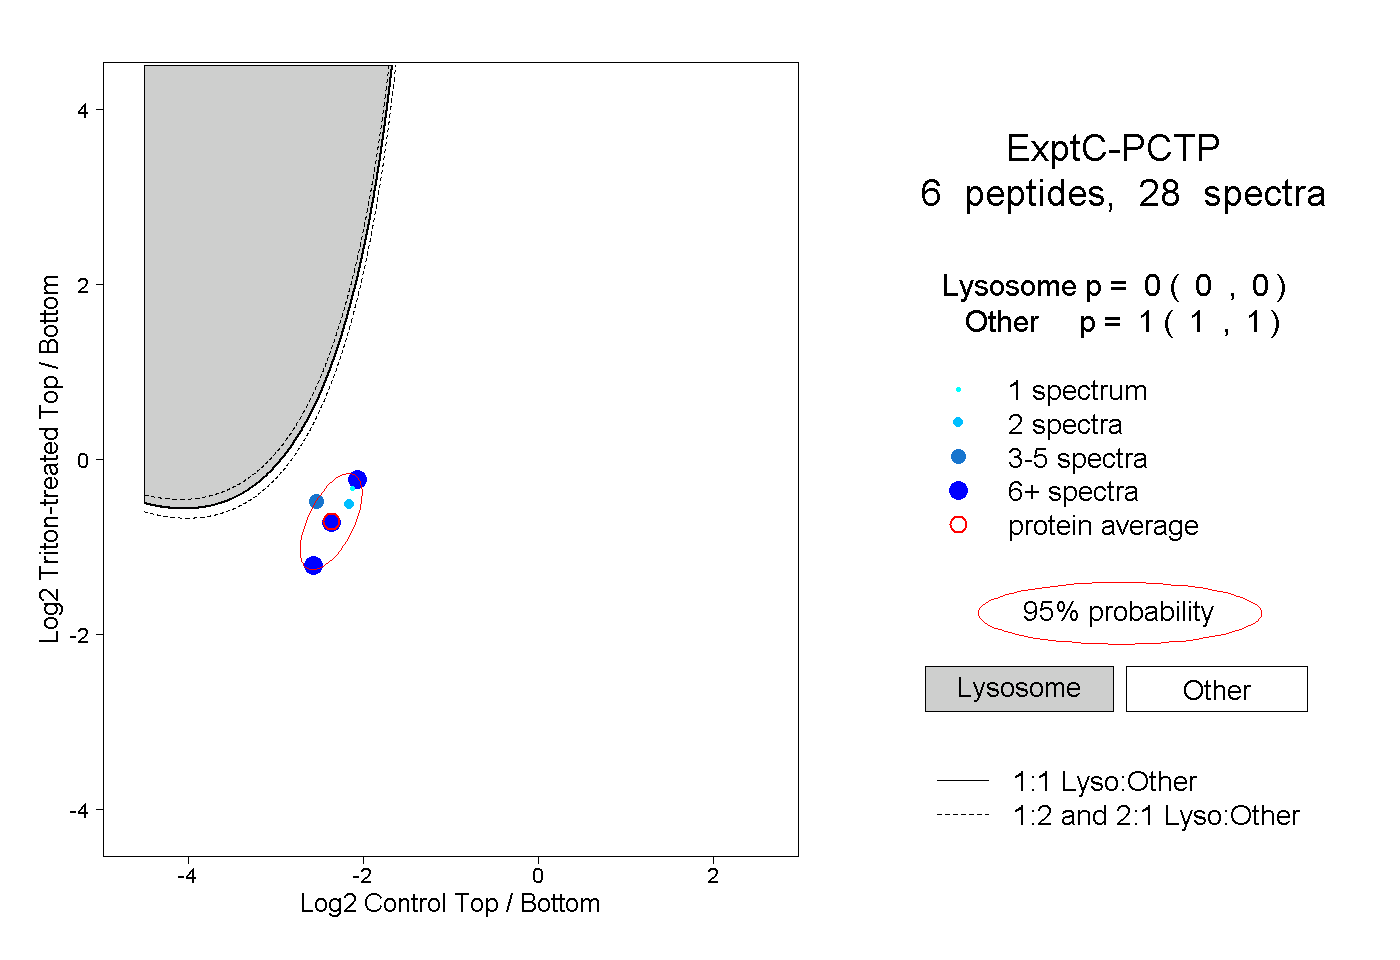 |
0.000 0.000 | 0.000 |
1.000 1.000 | 1.000 |
||||||||
| Plot | Lyso | Other | |||||||||||
| Expt D |
2 peptides |
2 spectra |
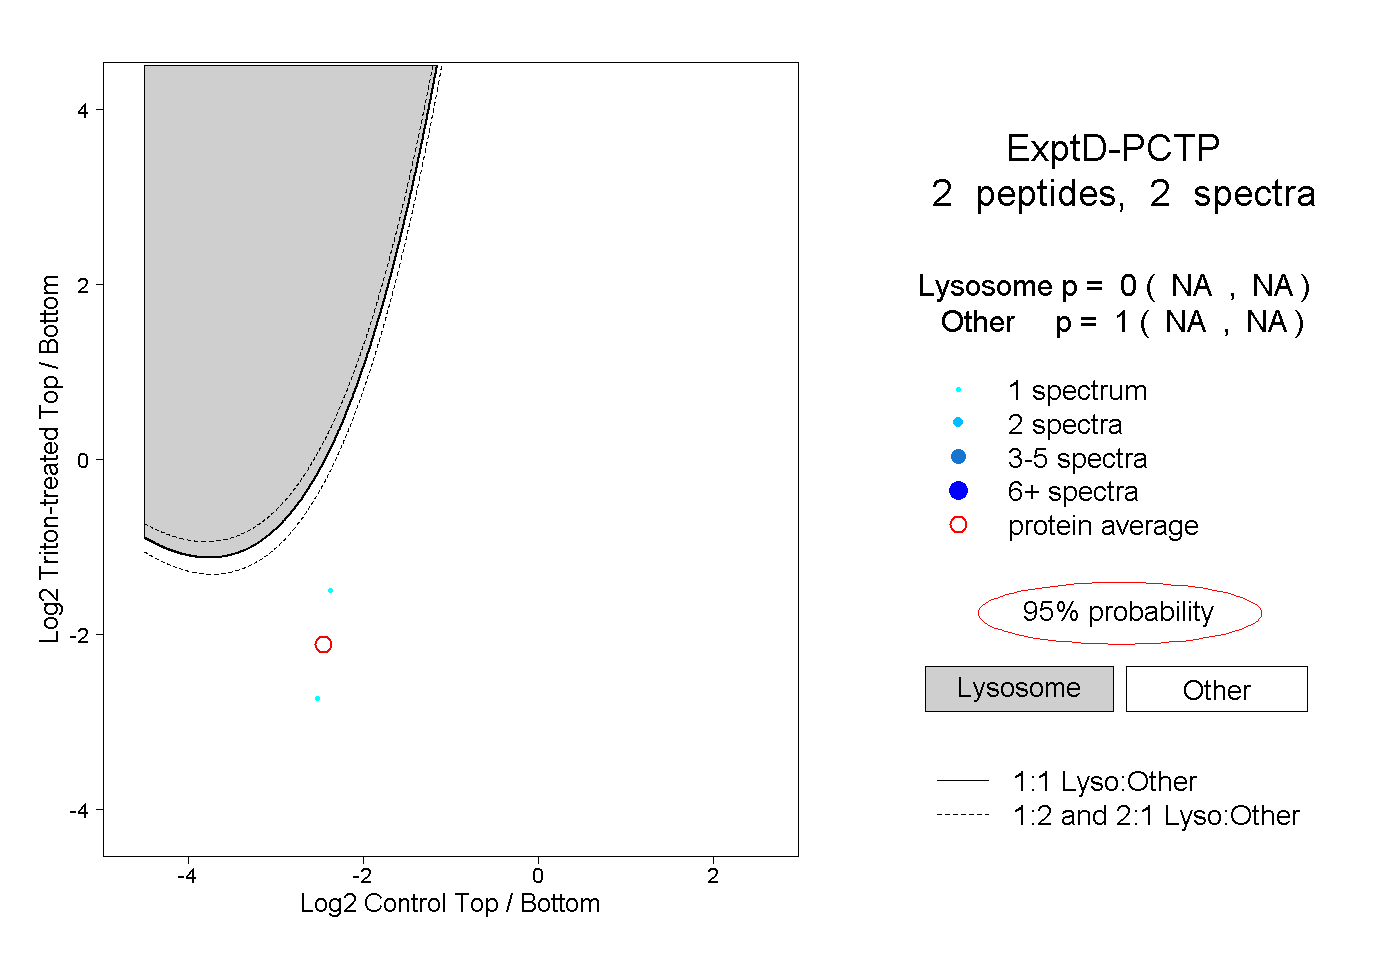 |
0.000 NA | NA |
1.000 NA | NA |